Hospitals & Asylums
American Political Economy HA-20-3-10
By Tony Sanders
Give me
your tired, your poor,
Your
huddled masses yearning to breathe free,
The
wretched refuse of your teeming shore.
Send
these, the homeless, tempest-tossed to me:
I lift my
lamp beside the golden door.
Inscription
on the Statue of Liberty
II.
First Bank of the United
States
III.
Second Bank of the United States
IV.
Democratic
and Republican War Party
VI.
Federal Reserve
VII.
Hooverville
VIII.
New Deals
IX.
World
War II
X.
Baby Boom
XI.
Oil Shock
XII.
Deregulation
XIII. Great Recession
Fig.
1.1 Estimated Population of the American Colonies
1610-1780
Fig.
1.2 Value of Exports to and Imports from England by American
Colonies and States 1700-1790
Fig.
1.3 American Tobacco Exported to England 1615-1695 and 1772
(in thousands of pounds)
Fig. 1.4 Tax Collections in
America under Difference Revenue Laws 1765-1774 (in pounds sterling)
Fig. 1.5 Tea Imports from England by American Colonies 1761-1775 (in pounds)
Fig. 2.1 Area and Population of the United States 1790-1850
Fig. 2.2 National Wealth 1774-1807 (in millions of dollars)
Fig. 3.1 National
Wealth 1825-1880 (in millions of dollars)
Fig. 3.2 Federal Budget and Debt 1820-1839 (in thousands of dollars)
Fig.
4.1 Slave and Free Population in the United States 1790-1870
Fig. 4.2 Individual Income Tax Collections 1863-1895 (in thousands of
dollars)
Fig. 5.1 Voter Participation in Presidential Elections 1824-2008
Fig. 5.3 Federal Income Tax First and Top Bracket Rates 1913-2008
Fig. 5.4 Foreign Born and Native
Population in the United States 1950-1990
Fig. 7.1 Depression's impact on the economy 1929 and 1933
Fig. 8.1 US Gross Domestic
Product 1910-1960 (in billions of 2005 dollars)
Fig. 8.2 US Unemployment
1910-1960
Fig. 9.1 National Debt as % of
GDP, 1929-1950
Fig. 10.1 U.S. Population Growth 1790-2000
Fig. 10.2 Total Revenues and Outlays as Percentage of GDP 1966 to 2007
Fig. 10.3 Health
Expenditure as a % of the U.S. GDP 1965-2005
Fig. 11.1 Average
Annual Inflation by Decade 1911-2003
Fig. 12.1 U.S.
International Trade in Goods 1965-2005
Fig. 12.2 Federal Budget and U.S. International Trade Deficits 1980-1991 (in
billions chained 2005 dollars)
Fig. 12.3 Effective Federal Tax Rates 1979 & 2000
Fig. 13.1 GDP Change from Previous Period, Annual and Quarterly
2000-2009
Fig. 13.2 Federal Budget and Debt 2000-2010
(in billions of dollars)
Fig. 13.3 Change in price of existing
houses, 1984-2007
Fig. 13.4 International Trade in Goods and
Services 2000-2009 (in billions of dollars)
Fig. 13.5 DJ Industrial Average 2005-2010
Fig. 14.1 Adult Correctional Population 1980-2008
Fig. 14.2 Population
Projections by Race 2008, 2050
Fig. 14.3 Top 10 National GDPs 2000-2050 (in
billions of dollars)
Fig. 14.4 U.S. Net International Investment
Position at Yearend 1989-2005
Ever
since the first settlement of Europeans in the New World America has been a
magnet for people seeking adventure, fleeing from tyranny, or simply trying to
make a better life for themselves and their children. An initial trickle swelled after the American
Revolution and the establishment of the United States of America and became a
flood in the nineteenth century, when million of people streamed across the
Atlantic, and a smaller number across the Pacific, driven by misery and
tyranny, and attracted by the promise of freedom and affluence (Friedman 80:
1). The eastern shore of North America
is a welcoming one. A broad coastal
plain made for easy settlement.
Peninsulas such as Cape Code and Delmarva, islands such as Long island,
and the barrier beaches farther south provided shelter for the early sailing
ships. This vast area was not
uninhabited. There were approximately
250 languages being spoken in North America at the beginning of the European
exploration, and about 2,000 in the Western Hemisphere as a whole. Even within languages, the people of North
America were divided into many small, often mutually hostile tribes. Low-level warfare was chronic amongst these
groups. Less than 1 percent of the
arable land of eastern North America was used for growing food crops. Technologically the eastern Indians were
Neolithic, using sophisticated tools but lacking metals. Once the Indians became used to the superior
metal tools, cloth and firearms of the Europeans, the skills needed to use the
raw materials at hand began to disappear.
Before long, the Indians had no choice but to trade for what they needed
on, losing their economic sovereignty.
Once that was gone, their political sovereignty and the rest of their
culture soon followed (Gordon 04: 5-6).
Fig.
1.1 Estimated Population of the American Colonies 1610-1780
|
|
1610 |
1620 |
1630 |
1640 |
1650 |
1660 |
1670 |
1680 |
1690 |
|
Total |
350 |
2,302 |
4,646 |
26,634 |
50,368 |
75,058 |
111,935 |
151,507 |
210,372 |
|
Negro |
|
|
60 |
597 |
1,600 |
2,920 |
4,535 |
6,971 |
16,729 |
|
|
1700 |
1710 |
1720 |
1730 |
1740 |
1750 |
1760 |
1770 |
1780 |
|
Total |
250,888 |
331,711 |
466,185 |
629,445 |
905,563 |
1,179,760 |
1,593,625 |
2,148,076 |
2,780,369 |
|
Negro |
27,817 |
44,866 |
68,839 |
91,021 |
150,024 |
236,420 |
325,806 |
459,822 |
575,420 |
Source:
Series Z 1-19 Historical Statistics of the United States: Colonial Times to 1970. Vol. 2 pg. 1168
On his return from discovering
America Columbus brought tobacco back to Europe and in the next century the
habit spread rapidly in the Old world, and the cultivation of tobacco had begun
to spread around the Mediterranean Basin.
The first permanent European settlement was founded by Captain John
Smith in Jamestown on May 14, 1607 (Friedman 80: 252). Life was hard, starvation and hostile natives
were constant threats. The local Indians
of eastern Virginia were also addicted to tobacco but the variety they grew was
not popular with the English colonists who preferred the tobacco produced by
the Spanish in the West Indies. Then in
1612 a man named John Rolfe brought some seeds he had obtained in Trinidad and
planted them. The grew abundantly in
Virginia with the help of the local Indians and in 1616 he took the first
commercial crop to England that was such a success they celebrated the first
American Thanksgiving upon his return in 1617. (Gordon 04: 42)). By 1616 the Virginia Company had transported
more than seventeen hundred people to Virginia and invested the staggering sum
of 50,000 pounds in its enterprise on the Chesapeake. To make back their money the English turned
to Nicotiana tabacum, tobacco. The first
law passed by the first General Assembly of Virginia, July 31, 1619, twelve
years after Captain John Smith landed and established at Jamestown the first
permanent settlement in the New World, was in reference to tobacco. It fixed the price of that staple at “three
shilling the beste, and the second sorte at 18d. the pounde:. Tobacco was already the local currency
(Friedman 80: 250). King James loathed
tobacco, which he regarded as an instrumentality of the devil, and he wrote and
published a pamphlet entitled A Counterblaste to Tobacco. His subjects, however, paid no attention
whatever to the royal opinion and smoking continued to increase in popularity
(Gordon 04: 14-15). At first slaves were
not very common, due to the short life expectancy of immigrants, it was more
profitable to hire indentured servants.
In 1650 there were only about three hundred slaves in Virginia, less
than 2 percent of the population. It
would be the 1660s before black slavery was even formally recognized in
Virginia law, and as late as the 1680s, indentured servants far outnumbered
slaves. The number of slaves doubled in
the 1680s and doubled again in the next decade. (Gordon 04: 20).
Fig. 1.2 Value of Exports to and
Imports from England by American Colonies and States 1700-1790
|
|
1700 |
1710 |
1720 |
1730 |
1740 |
|
Imports |
344,341 |
293,695 |
319,702 |
536,860 |
813,382 |
|
Exports |
395,021 |
249,814 |
468,188 |
572,585 |
718,416 |
|
|
1750 |
1760 |
1770 |
1780 |
1790 |
|
Imports |
1,313,083 |
2,611,764 |
1,925,571 |
825,431 |
3,258,238 |
|
Exports |
814,768 |
761,099 |
1,015,535 |
18,560 |
1,043,389 |
Source: Series Z 213-226 Historical Statistics of the United States: Colonial Times to 1970. Vol. 2
pg. 1177
British law effectively forbade
the establishment of banks in the colonies and also forbade the export of
British coinage from Britain, to preserve its own money supply. With no banks, American colonies could not
use banknotes. This left the colonies to
create a money supply as best they could.
Money is a commodity, no different from pork bellies, legal services, or
computer keyboards except in one vital respect.
Money, by definition, is a commodity universally acceptable in exchange
for every other commodity. An amazing
variety of items have been used as money at one time or another. Cowrie shells and beads have been the most
widely used forms of primitive money.
Metals, gold, silver, copper, iron, tin have been the most widely used
forms among more advances economies before the victory of paper and the
bookkeeper’s pen (Friedman 80:
250). Money serves two other functions
besides acting as a medium of exchange.
It is a unit of account, that is, the value of all other commodities is
expressed in terms of money. And money
acts as a store of value, a place to hold wealth temporarily between productive
investments (Gordon 04: 43). With the
English embargo on exporting coins, the new English colonies in America had to
solve the problem of getting a money supply another way. In 1652 Massachusetts began minting its own
coins despite strict laws forbidding anyone other than the royal mint to do
so. The pine tree shilling, the first
coin minted in North America, was produced for people who brought their own
silver. The British did not suppress its
production for thirty years. Other colonists turned to the Spanish dollar that
probably accounted for half the coinage in circulation in the North American
colonies. In New Netherlands and
elsewhere the fur trading Indians used wampum as a medium of exchange and so
too did their Dutch and English speaking customers. Wampum is beads made from the shells of the
freshwater clams that abound in the local lakes and rivers, analogous to the
cowrie shells used in Africa and Asia.
In 1760 however, J.C. Campbell of New Jersey opened a factory for making
counterfeit wampum, destroying the value of the genuine article (Gordon 04:
44).
The most intriguing of all
colonial money occurred in Maryland and Virginia where they resorted to what
economists call “commodity money” using tobacco. At various periods tobacco was declared the
only legal currency. It remained a basic
money of Virginia and its neighboring colonies for close to two centuries,
until well after the American Revolution.
It was the money that the colonists used to buy food, clothing, to pay
taxes, even to pay for a bride. As money
goes, so tobacco went. The original
price set on it in terms of English money was higher than the cost of growing
it, so planters set to with a will and produced more and more. As always happens when the quantity of money
increases more rapidly than the quantity of money increase more rapidly than
the quantity of goods and services available for purchase, there was
inflation. One law after another was
passed prohibiting certain classes of people from growing tobacco, providing for
destroying part of the crop, prohibiting the planting of tobacco for one
year. Finally, people took matters into
their own hands, banded together, and went around the countryside destroying
tobacco plants. The evil reached such
proportions that in April 1684, the Assembly passed a law declaring that these
malefactors had passed beyond the bounds of riot and that their aim was the
subversion of the government. It was
enacted that if any persons to the number of eight or more should go about
destroying tobacco plants, they should be adjudged traitors and suffer
death. Before the inflation ended about
a century later, prices in term of tobacco had risen fortyfold. In 1696 Virginia clergymen were paid sixteen
thousand pounds of tobacco a year in salary (Friedman 80: 250-252).
Fig. 1.3 American Tobacco
Exported to England 1615-1695 and 1772 (in thousands of pounds)
|
|
1615 |
1625 |
1635 |
1645 |
1655 |
1665 |
1675 |
1685 |
1695 |
1772 |
|
Total Exports |
2.5 |
131.8 |
1,500 |
4,500 |
6,500 |
14,000 |
17,659 |
28,000 |
28,000 |
106,979 |
Source:
Series Z 457-459 Historical Statistics of the United States: Colonial Times to 1970. Vol. 2 pg. 1191
The tobacco currency vividly
illustrates one of the oldest laws in economics, Gresham’s law, “bad money
drives out good”. The grower of tobacco,
who had to pay taxes or other obligations fixed in terms of tobacco,
understandably used the poorest quality tobacco to discharge obligations and
retained the best quality for export in return for “hard” money. Maryland in 1698 found it necessary to
legislate against the fraud of packing trash in hogsheads that contained good
tobacco on top. Virginia adopted a
similar measure in 1705, but apparently it did not offer relief. The quality problem was somewhat alleviated
when in 1727 tobacco notes were legalized.
These were in the nature of certificates of deposits issued by the
inspectors. They were declared by law
current and payable for all tobacco debts within the warehouse district where
they were issued. Despite numerous abuses
of the system, such receipts performed the office of currency right to the eve
of the 19th century. The
general principles of tobacco money in Virginia remain relevant in the modern
era, though paper money issued by government and bookkeeping entries called
deposits have replaced commodities or warehouse receipts for commodities as the
basic money of the society. Rev. Weems,
a Virginian writer, intimates that it would have done a man’s heart good to see
the gallant young Virginians hastening to the waterside when a vessel arrived
from London, each carrying a bundle of the best tobacco under his arm, and
taking back with him a beautiful and virtuous young wife. And another writer, quoting this passage,
goes on to remark, “they must have been stalwart, as well as gallant, to hasten
with a roll of tobacco weighing 100 to 150 pounds under the arm” (Friedman 80:
251-252).
By the turn of the eighteenth
century, the legislatures had established tobacco as the legal tender for
paying taxes and public debts.
Legislation set standards for minimum quality. In 1730 Virginia set up an inspection system,
requiring planters to bring their tobacco to public warehouses where it would
be inspected and warehouse receipts issued for its value. These warehouse receipts functioned in the
same way as banknotes, although they fluctuated in purchasing power far more,
being tied to a volatile commodity, tobacco (Gordon 04: 45). That did not stop them from issuing paper
money in the form of bills of credit, promises to pay in the future. Because they were legal tender in payment of
taxes and other government obligations, they circulated as money, although
often at a discount from face value. The
idea worked so well that it soon spread to other colonies in New England and to
Pennsylvania, which issued its first paper money in 1723. Benjamin Franklin, in 1729 when he was only
twenty-three, published a pamphlet entitled “A Modest enquiry in the Nature and
Necessity of Paper Currency. He was soon
rewarded with a contract to print future issues of Pennsylvania bills of credit
and typically devised several means of foiling counterfeiters, some of them
still in use to this day. Franklin,
however, minimized the fatal flaw inherent in what economists call “fiat money”
money that is money only because the government says it is money rather than
being made of or backed by a valuable commodity (Gordon 04: 46).
Only 20 percent
of all the royal governors in the whole of British America were American
(Bernard 68: 89). As absentees the Earls
of Orkney and Albemarle in succession held the governorship of Virginia for no
less than fifty-seven consecutive years, from 1697 to 1754, during which time
seven individuals came and went in the deputized office of lieutenant governor. The average duration of tenure of the fully
appointed crown governors in the mainland colonies was five years, and of this
period only the middle two or three years were effective politically, for a
year or so was consumed at the start in consolidating power and an equivalent
period of time was lost at the end when the incumbents were known as lame ducks
(Bernard 68: 91). Politics in America
were profoundly different from politics in England in that it operated at two
levels, the level of the provincial governments and the level of the central
government at “home”. Almost everyone
who attempted to manipulate English politics to the advantage of political
groups in the colonies found it necessary at one time or another to work
through professional political brokers, lawyers, commonly, who commanded the
recondite legal knowledge and the subtle political lore needed to thread the
dark passages of English politics (Bernard 68: 92). The work of the British
government was virtually restricted to preserving the constitution which meant
doing nothing about home affairs and conducting foreign policy (Bernard 68:
104).
Most colonies sought to do no more than re-create, or
adapt with minor variations, the forty-shilling freehold qualification that had
prevailed in the county constituencies of England for 300 years. But if ownership of land worth forty
shillings a years was a restrictive qualification in England, it was permissive
in the colonies where freehold tenure was almost universal among the white
population. Generalizing across the
variety of statutory provisions and practices of the various colonies, it seems
safe to say that fifty to seventy-five per cent of the adult male white
population was entitled to vote – far more than could do so in England, and far
more too, it appears, than wished to do so in the colonies themselves. Apathy in elections was common, in part
because of the physical difficulty of travel to polling places; in part because
of the lack of real alternatives in a society dominated by the sense that the
natural social leaders of society should the political leaders; in part because
of the lack, in certain periods and places, of issues that seemed properly
determinable at the polls (Bernard 68: 87-88).
Americans are famous for being practical people,
preferring fact to theory, finding the meaning of propositions in results,
regarding trial and error, not deductive logic, as the path to truth. “In no country in the civilized world, “ wrote
Tocqueville in Democracy in America, “is less attention paid to philosophy than
in the United States...The ideas of Americans are either extremely minute and
clear or extremely general and vague” (Schlesinger 99: 52).
In 1730 it was
written in the New York Gazette that the even balance of authority resulting
from the mutual dependence of the several parts of the English constitution is
the most complete and regular constitution that has ever been contrived by the
wisdom of man. A free government cannot
but be subject to parties, cabals and intrigues. Parties are a check upon one another, and by
keeping the ambition of one another within bounds, serve to maintain the public
liberty. Opposition is the life and soul
of public zeal which, without it, would flag and decay for want of an opportunity
to exert itself. It may indeed proceed
from wrong motives, but still it is necessary.
Not have the administration any reason to repine at it or to wish it at
an end since whatever motives it may have proceeded from, it has proved of
service both to them and to the public, even contrary perhaps to the design and
intent of the authors of it. There can
be no liberty without faction, for the latter cannot be suppressed without
introducing slavery in the place of the former.
Regard for liberty has always made me think that parties in a free state
ought rather to be considered as an advantage to the public than an evil. Because while they subsist I have viewed them
as so many spies upon one another, ready to proclaim abroad and warn the public
of any attack or encroachment upon the public liberty and thereby rouse the
members thereof to asset those rights they are entitled to by the laws (Bernard
68: 127).
Fig. 1.4 Tax Collections in America under Difference Revenue Laws 1765-1774
(in pounds sterling)
|
|
1765 |
1770 |
1774 |
|
Total |
17,383 |
33,367 |
27,995 |
|
Sugar Act |
14,091 |
30,910 |
27,074 |
|
Stamp Act |
3,292 |
--- |
--- |
|
Townshend Act |
--- |
2,727 |
921 |
|
Navigation Act |
2,964 |
1,828 |
672 |
Series: Z 611-615 Historical
Statistics of the United States: Colonial Times to 1970. Vol. 2 pg.
1200
By the mid-eighteenth century the political system, that had always been troubled and contentious, became explosive. It invoked both the deeply bred belief that faction was seditious, a menace to government itself, and the fear that the government was corrupt and a threat to the survival of Liberty (Bernard 68: 105). Starting in the 1760s King George III of Britain had imposed a number of onerous and unpopular laws and taxes on the American colonies including the Sugar Act and Currency Act of 1764; Stamp Act and Quartering Act of 1765, Tea Act of 1773 and 4 Intolerable Acts of 1774 (Sanders 09: 2.1). As early as 1767 American politics had entered a new phase. By then the train of events that manifestly led to Independence were clearly visible – Stamp Act, Townshend Duties, the Boston Massacre. The stamp tax was not a crushing tax; the Townshend duties, were withdrawn and the Boston Massacre was the result of a kind of urban riot common throughout the century, the Tea tax would have eliminated taxes on India Co. Tea lowering the cost of tea. These events were incendiary, it was resentment of the economic oppression of colonialism that led to the overthrow of constituted authority and, ultimately, to Independence (Bernard 68: 159) In response to this “taxation without representation” orators protested and many of the colonies wrote letters to Parliament and on December 17, 1773 a group of colonists dressed as Mohawk Indians threw three shiploads of tea into the Boston harbor and later Boston harbor was sealed off to punish the rebellious residents. In 1774 fifty-six delegates from twelve of the thirteen colonies met briefly in Philadelphia for the First Continental Congress and drafted a Declaration of Rights and Grievances ruling Parliament unconstitutional (Sanders 09: 2.1).
Fig. 1.5 Tea Imports from England by
American Colonies 1761-1775 (in pounds)
|
|
1761 |
1765 |
1770 |
1775 |
|
Total Tea Imports |
56,110 |
518,424 |
110.386 |
22,198 |
Source: Series Z 473-480 Historical Statistics of the United States: Colonial Times to 1970. Vol. 2 pg. 1192
The Founding Fathers had no doctrinal
commitment to the unregulated marketplace.
They were not proponents of laissez-faire. Their legacy was rather that blend of public
and private initiative known in our own day as the mixed economy (Schlesinger
99: 223). Early American corporations
were quasi-public agencies, chartered individually by statute. They were granted franchises, bounties, bond
guarantees, rights of way, immunities and other exclusive privileges to enable
them to serve specified public needs. In
many cases state governments bought shares in corporations and installed their
representatives on the board of directors (Schlesinger 99: 225). The
key insight of Adam Smith’s Wealth of Nations of 1776 is misleadingly simple:
if an exchange between two parties is voluntary, it will not take place unless
both believe they will benefit from it.
Most economic fallacies derive from the neglect of this simple insight,
from the tendency to assume that there is a fixed pie, that one party can gain
only at the expense of another. The
price system is the mechanism that performs this task without central
direction, without requiring people to speak to one another or to like one
another. The price system enables people
to cooperate peacefully in one phase of their life while each one goes about
his own business in respect of everything else (Friedman 80: 13). The price system works so well, so
efficiently, that we are not aware of it most of the time. Prices perform three functions in organizing
economic activity: first, they transmit information; second, they provide an
incentive to adopt those methods of production that are least costly and
thereby use available resources for the most highly valued purposes; third,
they determine who gets how much of the product – distribution of income
(Friedman 80: 14). If we will, from
building a society that relies primarily on voluntary cooperation to organize
both economic and other activity, a society that preserves and expands human
freedom, that keeps government in its place, keeping it our servant and not
letting it become our master (Friedman 80: 37).
Where does the government enter into this picture? To some extent government is a form of
voluntary cooperation, a way in which people choose to achieve some of their
objectives through governmental entities because they believe that is the most
effective means of achieving them (Friedman 80: 27).
II.
First Bank of the United States
The Founding Fathers were reared in an
anti-party tradition. The eighteenth
century had little use for parties. In
France Rousseau condemned those “intriguing groups and partial association
which by nourishing special interests, obscured the general will” (Schlesinger
99: 257). The American experience
exemplified the anti-party philosophy.
There were no parties in the colonial assemblies or in the Continental
Congress or under the Articles of Confederation. The Constitution made no provisions for
parties. Condemned by the Founding
Fathers, unknown to the Constitution, political parties imperiously forced
themselves into political life in the early years of the republic. Their extra-constitutional presence rapidly
acquired a quasi-constitutional legitimacy (Schlesinger 99: 258). The parties as national associations were a
force, against provincialism and separatism.
At the same time, they strengthened the fabric of unity by legitimizing
the idea of political opposition.
Parties performed an equally vital function within the national
government by supplying the means of overcoming one of the paradoxes of the
Constitution –the doctrine of the separation of powers (Schlesinger 99: 259).
British reformers are as dissatisfied with the fusion of powers as American
reformers are with the separation of powers (Schlesinger 99: 307). The first decennial census of the U.S. population
was taken in 1790, as required by the Constitution, in order to obtain the
population counts needed for Congressional apportionment (Campbell, Lennon 90).
Fig. 2.1 Area and Population of the
United States 1790-1850
|
|
1790 |
1800 |
1810 |
1820 |
1830 |
1840 |
1850 |
|
Land Area (square miles) |
864,746 |
864,746 |
1,681,828 |
1,749,462 |
1,749,462 |
1,749,462 |
2,940,042 |
|
Population |
3,929,214 |
5,308,484 |
7,239,881 |
9,638,453 |
12,866,020 |
17,069,458 |
23,191,876 |
|
Per square mile |
4.5 |
6.1 |
4.3 |
5.5 |
7.5 |
9.8 |
7.9 |
Source: Historical Statistics of the United States: Colonial Times to 1970.
Bicentennial Edition. Vol. 1. Pg. A-8
After the Revolution, the American economy was in profound recession. The country’s products were largely excluded from the British Empire, where most of its traditional markets had lain. Its currency, to the extent that it even amounted to a currency, was nearly worthless, its government’s debts were unpaid and un-payable. The importance that the Washington administration, which took office on April 30, 1789, placed on dealing with the financial situation confronting the government under the new Constitution can be judged by the numbers. While the newly created State Department had five employees, the Treasury had forty. A tax system had to be created, the debts from the Revolution had to be funded, the customs had to be organized to collect the duties that were to be the government’s main source of revenue for more than a century, the public credit had to be established so that the federal government could borrow when necessary. The theoretical monetary system devised by the Continental Congress under the Articles of Confederation had to be implemented. Thomas Jefferson, in his “Notes on the Establishment of a Money Unit” advocated not only using the dollar but making smaller units decimal fractions of the dollar, and the United States, in 1786, became the first country in the world to adopt a decimal system. Jefferson advocated coinage of a half dollar, a fifth, a tenth, for which he coined the word dime, a twentieth and hundredth of a dollar, for which he borrowed the word cent from Robert Morris’s scheme. In 1785 Congress declared that the “monetary unit of the United States of America shall be one dollar.” But the next year Congress, while adopting the cent, five-cent, dime and fifty-cent coins advocated by Jefferson, decided to authorize a quarter-dollar coin rather than a twenty-cent piece (Gordon 04: 68-70).
On September 11, 1789 Alexander Hamilton was confirmed by the Senate to be the first Treasury Secretary. To fund the government Congress passed the Tariff and Tonnage Acts, that imposed a duty of 6 cents a ton on American ships entering U.S. ports and 50 cents a ton on foreign vessels, in the summer of 1789. But, second only to slavery, the tariff would be the most contentious issue in Congress for the next hundred years. With funding in place, Hamilton’s most pressing problem was to deal with the federal debt, most of which had fallen into the hands of speculators who had bought it for as little as 10 percent of its face value. On January 14, 1790 Hamilton submitted to Congress his first “Report on the Public Credit” which called for redeeming the old debt on generous terms and issuing new bonds to pay for it, backed by the revenue from the tariff (Gordon 04:72-73). The other part of Hamilton’s fiscal policy was the establishment of a central bank, to be called the Bank of the United States and modeled after the Bank of England as directed in his “Report on a National Bank”. Hamilton expected the bank to carry out three functions. First it would act as a depository for government funds and facilitate the transfer of them from one part of the country to another. Second, it would be a source of loans to the federal government and to other banks. And third, it would regulate the money supply by disciplining state-chartered banks (Gordon 04: 76). Hamilton proposed a bank with a capitalization of $10 million, much larger than the combined capitalization of the three state banks of $2 million. The government would hold 20 percent of the stock of the bank and have 20 percent of the seats on the board. The secretary of the treasury would have the right to inspect its books at any time. The bill passed Congress with little trouble. Thomas Jefferson and his allies James Madison and Edmund Randolph, the attorney general, argued that the Constitution gave Congress the power only to pass laws “necessary and proper for carrying into Execution the foregoing Powers.” The sale of stock was a resounding success, the bank was very profitable and the three state banks in existence in 1790 became twenty-nine by the turn of the century, and the United States enjoyed a more reliable money supply than most nations in Europe (Gordon 04: 78-79)
Fig. 2.2 National Wealth 1774-1807 (in
millions of dollars)
|
|
1774 |
1784 |
1794 |
1800 |
1807 |
|
Total Wealth |
600 |
850 |
1,950 |
2,400 |
2,518 |
Source: Series A 1 Historical Statistics of the United States
In 1791 the federal government enacted an excise tax on distilled spirits. This was, of course, unpopular with the numerous producers of rum and whiskey, although they could, and did, pass the tax on to their customers. In July 1794 opposition to the tax flared into insurrection, and five hundred armed men burned the house of General John Neville, who was the regional inspector of the excise. On August 4 President Washington issued a proclamation ordering the rebels to disperse and militia to muster. When negotiations failed, Washington ordered thirteen thousand troops into western Pennsylvania, whereupon the rebellion melted away and two leaders were captured and convicted of treason, before Washington pardoned them. Today the so called Whiskey Rebellion is remembered mostly for being the only time in American history that the commander in chief has taken the field with his troops (Gordon 04: 99) Road construction after the Revolutionary war was an important economic development. Previously roads and Indian tracks were deeply rutted and often strewn with destroyed wagons. In the early part of the nineteenth century a Scottish engineer named John McAdam would perfect the technology of road building using layers of stone and gravel. The Philadelphia-Lancaster Turnpike was an immediate financial success for the company that built it, and this resulted in many turnpike projects getting under way. In 1802 the act of Congress that created the state of Ohio set aside funds from the sale of public lands for road construction. In 1811 a road from Cumberland, Maryland, on the Potomac, to Wheeling, in what is now West Virginia, on the Ohio River was authorized. The Cumberland Road would eventually extend all the way to Vandalia, Illinois, a distance of nearly five hundred miles (Gordon 04: 100). The need for canals to help develop the country and reduce the cost of many commodities in the New nation was obvious. By 1790, the no fewer than thirty canal companies had been charted in eight of the thirteen states (Gordon 04: 103).
|
Total Valuation for 1805 |
2,505.5 |
|
1 million habitation and
apparel for 6 million each $360 |
360 |
|
39 million acres of lands
averaged at $6 |
234 |
|
150 million acres of land adjoining
cultivated land averaged at $3 ½ |
525 |
|
451 million acres, residue,
averaged at $2 |
902 |
|
Carriages and livestock $70 per
family |
70 |
|
Turnpike, canal and toll bridge
stock |
15 |
|
10,000 mills valued not less
than $400 |
4 |
|
1 million slaves averaged at
$200 |
200 |
|
Products on hand for export |
26 |
|
Stock in trade |
150 |
|
Public buildings, churches,
arsenals, dock yards etc. |
19.5 |
Source:
Table 1 Historical Statistics of the United States
A real stock exchange was established in Philadelphia near the headquarters of the Bank of the United States in 1792. In New York a group of twenty-one individual brokers and three firms signed an agreement, called the buttonwood Agreement because it was, at least according to tradition, signed beneath a buttonwood treat, today more commonly called a sycamore outside 68 Wall Street. In it they pledged “ourselves to each other, that we will not buy or sell from this day for any person whatsoever any kind of Public Stock, at a less rate than one quarter per cent Commission on the specie value, and that we will give preference to each other in our negotiations”. The new group formed by the brokers was far more a combination in restraint of trade and price-fixing scheme than a formal organization, but it proved to be a precursor of what today is called the New York Stock Exchange (Gordon 04: 79). In 1817 the New York stock exchange was formally established. Wall Street had been growing quickly but New York needed a stock exchange like Philadelphia had since 1792. On February 25, 1817 several leading New York brokers met and drew up a constitution that was, in fact, nearly identical with the constitution of the Philadelphia exchange. There were just twenty-eight original members of the Board of Brokers, who soon changed their name to the New York Stock and Exchange board. They rented the second floor of the Bank of New York headquarters at 40 Wall Street for $200 a year, including heat. They changed their name in 1863 to the New York Stock Exchange (Gordon 04: 111-112).
The Charter of the Bank of the United States had a term of twenty years and was due to run out in 1811. By that time there were more than a hundred state banks in operation. The Bank of the United States, headquartered in Philadelphia, had opened branches in New York, Boston, Baltimore and Charleston, the major American ports, within a year of its creation. By 1810 it also had branches in Washington, New Orleans, Savannah, and Norfolk as well. Its interstate branches and its monopoly on deposits of the federal government made it by far the most powerful bank in the country and the only one whose notes were accepted at par everywhere. James Madison, who had opposed its creation was president, he recognized the bank’s utility both as agent for the federal government and as a provider of a uniform national currency. His secretary of treasury, Albert Gallatin, also pushed hard to have the bank’s charter renewed. The charter was due to expire on March 4, 1811 and the Madison administration submitted a bill to renew it for twenty years on January 24, 1811. Madison however did not push hard enough, nor keep members of his administration in line, and when his vice president George Clinton of New York, broke a tie vote in the Senate against the bank bill, the measure died. It was the most significant independent political, nearly the only one, in the history of the vice presidency. Most of the branches were re-charted by the states where they were located and the headquarters were sold, building, furniture and all to Stephen Girard, a Philadelphia merchant (Gordon 04: 116-117). With the extinction of the Bank of the United States, state banks proliferated, more than doubling in the two years after 1811. Most issued banknotes. Adam Smith had estimated that a bank could safely issue banknotes in the amount of five times capital, and some states restricted banknotes to three times capital, but other states placed no such limits (Gordon 04: 121).
III.
Second Bank
of the United States
The Madison administration wanted a new central bank. Madison vetoed one bill in 1815 on technical grounds, but signed a bill sent to him in 1816, chartering a Second Bank of the United States for twenty years (Gordon 04: 121). In 1819 President Madison appointed Biddle to the board of directors of the Second Bank of the United States and in 1823 he became president of the bank, after the first president, William Jones resigned after an investigation of his speculation of bank stock. But while the Second bank of the United States, headquartered in Philadelphia like the first one, would after a shaky start, be a stabilizing influence on the American monetary system, it would never have the power to control it that the first bank had. Some states had sound banking laws. Missouri, admitted to the Union in 1821 and Indiana, admitted to the Union in 1816, had single, state-owned, many-branched central banks of their own, a system that worked well. Louisiana (1812) closely regulated its commercial banks and had a wide reputation for sound banking. Illinois (1818) on the other hand, had an equally wide reputation for flimflam, fraud and failure among its banks. Bank failure became endemic in this era. Fully half the banks founded between 1810 and 1820 had failed by 1825. Hundreds more sprang up (Gordon 04: 122).
Fig.
3.1 National Wealth 1825-1880 (in millions of dollars)
|
Year |
Wealth |
Year |
Wealth |
Year |
Wealth |
Year |
Wealth |
|
1880 |
43,300 |
1865 |
20,820 |
1851 |
7,981 |
1838 |
4,900 |
|
1879 |
41,437 |
1864 |
19,809 |
1850 |
7,135 |
1837 |
4,759 |
|
1878 |
39,430 |
1863 |
18,838 |
1849 |
6,918 |
1836 |
4,612 |
|
1877 |
37,579 |
1862 |
17,906 |
1848 |
6,707 |
1835 |
4,470 |
|
1876 |
35,794 |
1861 |
17,013 |
1847 |
6,501 |
1834 |
4,333 |
|
1875 |
34,074 |
1860 |
16,160 |
1846 |
6,302 |
1833 |
4,200 |
|
1874 |
32,420 |
1859 |
15,200 |
1845 |
6,109 |
1832 |
4,071 |
|
1873 |
30,831 |
1858 |
14,252 |
1844 |
5,922 |
1831 |
3,946 |
|
1872 |
29,308 |
1857 |
13,318 |
1843 |
5,739 |
1830 |
3,825 |
|
1871 |
27,851 |
1856 |
12,396 |
1842 |
5,563 |
1829 |
3,708 |
|
1870 |
26,460 |
1855 |
11,488 |
1841 |
5,392 |
1828 |
3,594 |
|
1869 |
25,253 |
1854 |
10,591 |
1840 |
5,226 |
1827 |
3,484 |
|
1868 |
24,086 |
1853 |
9,708 |
1839 |
5,066 |
1826 |
3,377 |
|
1867 |
22,958 |
1852 |
8,838 |
|
|
1825 |
3,273 |
|
1866 |
21,869 |
|
|
|
|
|
|
Source:
Series A 2 Historical
Statistics of the United States 1970
No one, had more influence on shaping the Democratic Party and its economic philosophy before Franklin Roosevelt than Andrew Jackson. Indeed, the modern Democratic Party coalesced around Jackson’s extraordinary political personality. Jackson believed in pushing the locus of power down to the social scale and had a deep-seated dislike of inherited privilege and what Jackson called “the money power” which is to say banks, especially large, well-established and powerful ones. Jackson had been born very poor and had no intention of dying poor. Andrew Jackson represented a revolution in American politics. He did not have much formal education, but studied law in a law office and was admitted to the bar in 1887, he then became a land speculator and acquired hug tracts of land, he was then a general in the Indian war. He fought no fewer than three duels, killing at least one of his opponents. To Jackson real money was specie, gold and silver coins, paper money and what commercial paper, bills of exchange, promissory notes, bank checks, and such, were a form of fraud (Gordon 04: 124). Andrew Jackson’s first order of financial business was to pay off the national debt. The national debt, which had stood at over $80 million 1792, had been reduced to only $45 million by 1811. The War of 1812 had then caused the debt to soar to more than $125 million by 1815. The high tariff generated large surpluses after the war and by the time Jackson reached the presidency, it stood at $48,565,000 (Gordon 04: 125). Jackson wanted to rid the country of debt for two reasons. The first was that debt was bad in and of itself. The second was to prevent a moneyed aristocracy from growing up around the administration. To achieve his goal Jackson was perfectly willing to sacrifice internal improvements such as roads saying when the money was paid off there would be plenty of money for improvements. By the end of 1834 Jackson was able to report to congress the State of the Union message that the country would be debt free on January 1, 1835 and have a balance on hand of $444,000. Chief Justice Roger B. Taney not that it was “the first time in the history of nations that a large public debt has been entirely extinguished”. It remains the only time to this day (Gordon 04: 125).
Fig. 3.2 Federal Budget and Debt 1820-1839
(in thousands of dollars)
|
Year |
Revenues |
Expenditures |
Balance |
Debt |
Year |
Revenues |
Expenditures |
Balance |
Debt |
|
1820 |
17,881 |
18,261 |
-380 |
91,016 |
1830 |
24,844 |
15,143 |
9,701 |
48,565 |
|
1821 |
14,573 |
15,811 |
-1,238 |
89,987 |
1831 |
28,527 |
15,248 |
13,279 |
39,123 |
|
1822 |
20,232 |
15,000 |
5,232 |
93,547 |
1832 |
31,866 |
17,289 |
14,577 |
24,322 |
|
1823 |
20,541 |
14,707 |
5,834 |
90,876 |
1833 |
33,948 |
23,018 |
10,930 |
7,012 |
|
1824 |
19,381 |
20,327 |
-946 |
90,270 |
1834 |
21,792 |
18,628 |
3,164 |
4,760 |
|
1825 |
21,841 |
15,857 |
5,984 |
83,788 |
1835 |
35,430 |
17,573 |
17,857 |
38 |
|
1826 |
25,260 |
17,036 |
8,224 |
81,054 |
1836 |
50,827 |
30,868 |
19,959 |
38 |
|
1827 |
22,966 |
16,139 |
6,824 |
73,987 |
1837 |
24,954 |
37,243 |
-12,289 |
337 |
|
1828 |
24,764 |
16,395 |
8,369 |
67,475 |
1838 |
26,303 |
33,865 |
-7,562 |
3,308 |
|
1829 |
24,828 |
15,203 |
9,625 |
58,421 |
1839 |
31,488 |
26,899 |
4,589 |
10,434 |
Source: Series Y 352-357 and Y 493-504 Historical Statistics of the United States 1970
In regards to the Second Bank of the United States, it was not an issue in the presidential campaign of 1824, when Jackson won a plurality of the popular vote, but lost in the House of Representatives to John Quincy Adams, or in 1828, when Jackson won a smashing victory over the unpopular Adams. The President of the Bank Biddle voted for Jackson in both elections. But hardly had Jackson entered the White house than his hatred of banks, especially large, powerful ones, manifested itself in his first message to Congress as president. He raised the question of re-chartering the Second Bank of the United States a full seven years before its charger was due to expire. By 1832, when Jackson ran for reelection, it was clear that he intended to kill the bank. Biddle fought back as best he could. Many congressmen enjoyed good relations with the bank and Biddle pressed them to pass a bill re-chartering the bank for fifteen years before congress adjourned for the summer of 1832. Congress finally passed the re-charter bill and prepared to adjourn, but Jackson issued a blistering veto message that was as much a campaign speech as an act of statecraft. He argued that the bank was a monopoly and favored the rich and powerful over the ordinary citizens of the country. Further, despite Supreme Court rulings to the contrary, he declared it unconstitutional. Congress was unable to override the veto (Gordon 04: 128). When Jackson won a landslide victory that November, the Second Bank of the United States, although it had four years left on its charter, was at best a dead man walking. Nor was Jackson content to simply allow the charter to expire. He began to withdraw federal deposits and move them to what his opponents soon dubbed “pet banks” (Gordon 04: 128)
Although there was a brief dip in 1834 when
the Second Bank of the United States called in its loans, prosperity was
widespread and the number of banks in the country increased from 329 in 1829 to
788 in 1835. The face value of banknotes
tripled and outstanding loans quadrupled (Gordon 04: 127-128). With the national debt paid off and the
government running large surpluses, government revenues increased by 150
percent between 1834 and 1836, in part due to greatly increased land sales,
Jackson convinced Congress to give it to state governments for
improvements. The prosperity however
didn’t last long after Jackson. In the
Panic of 1837, faced with having their government deposits withdrawn the pet
banks began to call in loans and a wave of bank failures swept across the west
and rolled eastward. The Bank of England
raised interest rates to prevent an outflow of gold. Wall Street plunged, interest rates, once 7
percent a year, were 2 or even 3 percent a month. The American economy began to slide into a
deep depression. By early fall, 90
percent of the nation’s factories were closed.
Federal revenues fell by half.
Andrew Jackson’s successor, Martin van Buren, had to suffer the
political consequences of the longest economic depression in the nation’s
history, that didn’t reach bottom until February 1843, seventy-two months after
it began. Van Buren's
remedy--continuing Jackson's deflationary policies--only deepened and prolonged
the depression. Declaring that the panic was due to recklessness in
business and overexpansion of credit, Van Buren devoted himself to maintaining
the solvency of the national Government. He opposed not only the creation of a
new Bank of the United States but also the placing of Government funds in state
banks. He fought for the establishment of an independent treasury system to
handle Government transactions. As for Federal aid to internal improvements, he
cut off expenditures so completely that the Government even sold the tools it
had used on public works (Gordon 04: 130).
The first half of the nineteenth century was a story of industrialization and progress. As cities grew in size in the first decades of the nineteenth century, the problem of supplying the inhabitants with water and disposing of sewage increased. In the early years of the century the affluent had rain barrels or cisterns, fed from their rooftops, but the rest had to haul water from the nearest well. This water was often grossly contaminated from the sewage from privies and the chamber pots that were emptied into the streets. Although not understood at the time, this was the source of the frequent epidemics of such diseases as yellow fever and cholera that ravaged American cities at this time. Philadelphia was the first city to build a modern water supply that could be piped into houses and allow waste to be disposed of through sewers. In 1832 the first houses in America to be built with bathrooms were supplied by this system. New York, surrounded by salt water, had a far more difficult technological problem to deal with. Nonetheless, after building a forty-five mile long aqueduct to bring water in New York opened the Croton System on July 4, 1842. The miracles of daily piled one upon the other in the first decades of the nineteenth century – railroads, telegraph, newspapers, heating, lighting, running water – inducing a mood of optimism and a belief in progress that had not been known before (Gordon 04: 166).
Believers in aristocracy and
socialism share a faith in centralized rule, in rule by command rather than by
voluntary cooperation. They differ in
who should rule, whether an elite determined by birth or experts supposedly
chosen on merit. Both proclaim, no doubt
sincerely, that they wish to promote the well-being of the “general public”
that they know what is in the “public interest” and how to attain it better
than the ordinary person (Friedman 80: 97-98).
Alexis de Tocqueville, the famous French political philosopher and
sociologist, in his classic Democracy in America, written after a lengthy visit
in the 1830s, saw equality, not majority rule as the outstanding characteristic
of America. He wrote, “the aristocratic
element has been feeble from its birth…The democratic principle, on the
contrary, has gained so much strength by time, by events, and by legislation,
as to have become not only predominant but all-powerful. There is no family or corporate
authority. America, then, exhibits in
her social state a most extraordinary phenomenon. Men are there seen on a greater equality in
point of fortune and intellect, or, in other words, more equal in their
strength, than in any other country of the world…There is a manly and lawful
passion for equality which incitement to wish to be powerful and honored…But
there exists also in the human heart a depraved taster for equality, which
impels the weak to attempt to lower the powerful to their own level, and
reduces men to prefer equality in slavery to inequality with freedom.”
(Friedman 80: 130-131).
IV.
The
Democratic and Republican War Party
Shortly after the Revolution
began, so too did the abolition of slavery.
Vermont, in declaring its own independence from Britain in 1777, also
abolished slavery, becoming the first place in the Western Hemisphere to make
the practice illegal. Other northern
states soon followed. Even New York,
with nineteen thousand slaves in 1790, about 5.5 percent of the population,
began gradual emancipation in 1799 and had freed all its slaves by 1827. The Northwest Ordinance of 1787 forbade
slavery north of the Ohio River. In the
South, manumission became fashionable, and many planters, George Washington
among them, freed their slaves upon their own deaths. The Constitutional Convention, in 1787, found
it necessary, in order to reach agreement, not only to forbid outlawing the
slave trade prior to 1808, but to make that clause un-amendable. But by 1808 public opinion, even in the
South, had swung so against the trade that Congress abolished it as soon as it
legally could so do, on January 1 of that year.
Abolishing the slave trade and actually suppressing were two different
matters, however. The invention of the
cotton gin changed things. After 1793
the price of a slave ratcheted upward. A
slave who would have sold for $300 before the cotton gin was selling for $2,000
and more by 1860. The slave holders,
possessed of an increasingly valuable asset, became more interested in
preserving their “peculiar institution” and as tobacco became less important to
the economy of such states as Virginia and Maryland, they began to sell surplus
slaves south so that between 1790 and 1860 some 835,000 slaves were sold
south. While slavery was found
throughout the South, it was not widely spread among the population. In 1860, while the white population of the
South was more than eight million, there were only 383,637 slave owners and
only 2,292 held more than a hundred slaves.
But slavery had become bound up with the very identity of the South and
its way of life (Gordon 04).
Fig. 4.1 Slave and Free
Population in the United States 1790-1870
|
Year |
Slaves |
Free Blacks |
Total Black |
% Free Blacks |
US Population |
% black of US |
|
1790 |
697,681 |
59,527 |
757,208 |
7.9% |
3,929,214 |
19% |
|
1800 |
893,602 |
108,435 |
1,002,037 |
10.8% |
5,308,483 |
19% |
|
1810 |
1,191,362 |
186,446 |
1,377,808 |
13.5% |
7,239,881 |
19% |
|
1820 |
1,538,022 |
233,634 |
1,771,656 |
13.2% |
9,638,453 |
18% |
|
1830 |
2.009,043 |
319,599 |
2,328,642 |
13.7% |
12,860,702 |
18% |
|
1840 |
2,487,355 |
386,293 |
2,873,648 |
13.4% |
17,063,353 |
17% |
|
1850 |
3,204,313 |
434,495 |
3,638,808 |
11.9% |
23,191,876 |
16% |
|
1860 |
3,953,760 |
488,070 |
4,441,830 |
11.0% |
31,443,321 |
14% |
|
1870 |
0 |
4,800,009 |
4,800,009 |
100% |
38,558,371 |
13% |
Source:
Wikipedia
Worried over their growing minority status, and enraged over the attempt of the North to force emancipation upon Missouri when it applied for admission as a slave state in 1819, white southerners for the first time threatened secession during the debates that resulted in the Missouri Compromise of 1820. The heart of the compromise was the drawing of a line through the Louisiana Purchase territory that prohibited slavery north of the latitude 36°30′ and allowed it to the south. President Andrew Jackson forced the Nullifiers to back down, but of greater concern in the 1830s to southerners anxious over the future of slavery was the sudden emergence of an abolitionist movement in the North. When northern congressmen rallied behind the Wilmot Proviso in 1846 in an effort to bar slavery from any territories gained in the Mexican War, southerners formed their own sectional bloc and forced the ultimate defeat of the proviso. The congressional Compromise of 1850, permitted California to enter the Union as a free state. The remaining land won in the Mexican War was divided into the territories of Utah and New Mexico with no conditions placed on the status of slavery. In 1854, the Kansas‐Nebraska Act reopened the entire controversy. In order to gain essential southern support for his bill organizing the remaining Louisiana Purchase territory north of 36°30′, Democratic senator Stephen A. Douglas of Illinois had to revoke the Missouri Compromise restriction on slavery. The ruling of the Supreme Court in the Dred Scott decision of 1857 that Congress had no constitutional authority to prohibit slavery in the territory further polarized sectional attitudes, and northern Democrats led by Douglas lost the trust of the southern wing of the party when they joined Republicans in blocking the admission of Kansas as a slave state. The decade came to a close with abolitionist John Brown's unsuccessful raid against the federal arsenal at Harpers Ferry, Virginia, in October 1859, for which he was hanged.
The Republican Party grew out of the conflicts regarding the expansion of slavery into the new Western territories. The stimulus for its founding was provided by the passage of the Kansas-Nebraska Act of 1854. That law repealed earlier compromises that had excluded slavery from the territories. The passage of this act served as the unifying agent for abolitionists and split the Democrats and the Whig party. "Anti-Nebraska" protest meetings spread rapidly through the country. Two such meetings were held in Ripon, Wis., on Feb. 28 and Mar. 20, 1854, and were attended by a group of abolitionist Free Soilers, Democrats, and Whigs. They decided to call themselves Republicans-because they professed to be political descendants of Thomas Jefferson's Democratic-Republican party. The name was formally adopted by a state convention held in Jackson, Mich., on July 6, 1854. In the 1854 congressional elections 44 Republicans were elected to the House of Representatives and several were elected to the Senate and various state houses. In 1856, at the first Republican national convention, Sen. John C. Fremont was nominated for the presidency but was defeated by Democrat James Buchanan. Two days after the inauguration of James Buchanan, the Supreme Court of the United States handed down the Dred Scott v. Sandford decision, which was denounced by the Republicans. The split in the Democratic party over the issue of slavery continued, and in 1858 the Republicans won control of the House of Representatives for the first time.
The second Republican national convention in 1860 resulted in the presidential nomination of Abraham Lincoln. The Republican platform pledged not to extend slavery and called for enactment of free-homestead legislation, prompt establishment of a daily overland mail service, a transcontinental railroad, and support of the protective tariff. Lincoln was opposed by three major candidates-Stephen Douglas (Northern Democrat), John Cabell Breckinridge (Southern Democrat), and John Bell (Constitutional Union party). Lincoln received almost half a million votes more than Douglas, but won the election with only 39.8 percent of the popular vote. Pushing the constitutional doctrine of states' rights to its logical extreme, the secessionists held that individual states retained ultimate sovereignty within the Union and could peacefully leave the Union the same way they had entered it through special state conventions. South Carolina took the lead on 20 December 1860, and within six weeks seven states from the Lower South left the Union. Delegates from these states set up the provisional government of the Confederate States of America at Montgomery, Alabama, in February 1861 (Levine 1992).
The American Civil War was the largest war fought in the Western world in the century between the Battle of Waterloo, of June 18, 1815 and the outbreak of World War I on August 1, 1914. Spread across half a continent, the troops moved by railroads and commanded by telegraph, the people informed by large-circulation newspapers, it was the first great conflict of the industrial era. Because the Civil War was far more like the great conflicts of the twentieth century than such earlier struggles as the Napoleonic War, both sides faced demands on their government finances and the economies that supported them that no nation had faced before. The fact that the North, with a far larger economy and a government fiscal system already in place, played no small part in the war’s eventual outcome. Because of the depression that had started in 1857, the federal government had been operating in deficit since that time. In 1860 the national debt stood at $64,844,000 and the Treasury was nearly depleted. Since the demise of the Second Bank of the United State, the federal government had financed deficits mostly by borrowing from other banks. To raise the money needed to fight the war they sold bond directly to citizens. This was successful and by May 1864 the government was actually raising money as fast as the Navy and War Departments could spend it, $2 million a day. The Northern bond sales caused a breathtaking rise in the national debt that had stood at 93 cents per person in 1857, before the depression hit, eight years later it stood at $75 per person. Before the Civil War the United States government had never spent more in a single year than $74.2 million in 1858. In 1865 alone it spent $1.297 billion, the first time in history that any nation had a billion dollar budget. Since the Civil War the federal government has never spent less tan $236.9 million in 1878 (Gordon 04: 193-194).
Fig. 4.2 Individual Income Tax Collections
1863-1895 (in thousands of dollars)
|
Year |
Amount |
Year |
Amount |
Year |
Amount |
Year |
Amount |
|
1895 |
77 |
1874 |
139 |
1870 |
37,776 |
1866 |
72,982 |
|
1884 |
56 |
1873 |
5,062 |
1869 |
34,792 |
1865 |
60,979 |
|
1881 |
3 |
1872 |
14,437 |
1868 |
41,456 |
1864 |
20,295 |
|
1876 |
1 |
1871 |
19,153 |
1867 |
66,014 |
1863 |
2,742 |
Source: Table III Series Y 360-373 Historical Statistics of the United States: Colonial Times to 1970.
Bicentennial Edition. Vol. 2. Pg. 1091
In August 1861 the first American income tax was passed by Congress at the behest of then Secretary of Treasury, Salmon P. Chase, who would rule it unconstitutional ten years later from the Supreme Court. It taxed all income, “whether derived from any kind of property, rents, interests, dividends, salaries, or from any trade, employment or vocation carried on in the United States or elsewhere, or from any source whatever”. It originally called for a tax of 3 percent on incomes of more than $800, then a middle class income, rising to 5 percent on incomes of more than $10,000, a very comfortable income. In 1864 the income on taxes in excess of $10,000 was doubled to 10 percent. Virtually everything else was taxes as well. Stamp taxes were imposed on legal documents and licenses, excise taxes on most commodities. The tax on liquor reached $2.50 a gallon, when the price, untaxed, would have been about 20 cents. The gross receipts of railroads, ferries, steamboats, and toll bridges were taxed. Advertising was taxed. The tariff was sharply increased. Altogether the federal government raised fully 21 percent of its revenues by taxation. The South, with its less developed and cash poor economy was able to raise only about 6 percent of its revenues by taxation (Gordon 04: 194).
To finance the war effort both North and South were forced to print money. The consequences of issuing large quantities of what economists call fiat money, money that is money only because the government says it is money, are inevitable and were as well known then as now. The first thing to happen is that Gresham’s law kicks in – good money, gold and silver, disappears into mattresses as people hoard it, while they spend the money perceived to be less valuable or trustworthy. The second thing to happen is that inflation takes off. As printing press money flooded the Southern economy, inflation increased more than 700 percent in the first two years of the war alone. The North resorted to the printing press as well. With congressional authorization the Treasury began issuing greenback, so called because they were printed in green ink on the reverse. By 1965 the country had issued $450 million in greenbacks, amounting to about 11 percent of federal spending in those years. While there was inflation it was kept to a manageable 75 percent or so. Although the federal government had no hesitation in paying its bills with greenbacks, and requiring people to accept them by making them legal tender, the federal government itself did not accept them in payment of taxes. Taxes and international trade had to be paid in gold (Gordon 04: 197).
During the Civil War industrialization expanded exponentially. The demands of what became the largest army in the world and navy second only to Britain fueled the increase in production. So did the tariff, which caused imports to drop dramatically. In 1860 American imports had been valued at $354 million, two years later they were only $189 million, despite a quickly expanding economy. The difference was made up by American manufactures. In 1859 there had been 140,433 manufacturing firms in the United States, a decade later there would be 252,148. The domestic production of iron railroad rails went from 205,000 tons in 1860 to 356,000 five years later to 620,000 tons in 1870. The process for canning condensed milk patented in 1856 sparked a boom in the food processing industry (Gordon 04: 201). During the entire colonial period there had been only 7 companies incorporated in the British North American colonies. But in the last four years of the eighteenth century 335 businesses incorporated in the new United States. Between 1800 and 1860 the state of Pennsylvania alone incorporated more than 2,000. The corporation had numerous advantages over partnerships. Partnerships ended with the death of a partner, whereas corporations could last forever. Most important, corporation can sue, and be sued and buy, own, and sell property as an entity. Chief Justice John Marshall described the corporation as “an artificial being that was invisible, intangible and existing only in contemplation of the law.” Corporations can also merge (Gordon 04: 229).
After the war, as a result of the new taxes and industrialization the government ran a string of twenty-eight straight surpluses beginning in 1866. In the prosperous year of 1882, government revenues ran ahead of outlays by a staggering 36 percent. By the turn of the century the huge Civil War debt had been cut by nearly two –thirds of in absolute dollars, and as a percent of GDP had dropped more steeply still, from about 50 percent to well under 10 percent. The Civil War income tax had been cut in 1867 to a uniform 5 percent on incomes more than $1,000. Three years later the rate was reduced again, and in 1872 the tax was eliminated altogether (Gordon 04: 272). The expansion of the American railroads after the Civil War was nothing less than extraordinary. With 30,626 miles of track in 1860, the United States already had a larger railroad system than any country in the world. By 1870 it had 52,922 miles, in 1880, 93,262 miles, in 1890, 166,703 miles. In 1900 it had 193,346 miles, a more than six-fold increase in forty years. While the annual value of manufactured goods in the United States increased by seventeen times between 1865 and 1916, the annual freight ton-mileage of the railroads increased by thirty-five times. By the turn of the century the railroads tightly knitted together an economy that was fully national in scope, and nearly every town of any size was served by a railroad. The major cities were usually served by several (Gordon 04: 235).
The greatest success story of this time was that of Andrew Carnegie who came from a poor family and worked his way up in the railway business and by 1880 Carnegie Steel Company dominated the steel industry. While the late-nineteenth century economy was built by steel, it was increasingly fueled by oil (Gordon 04: 247). The prevailing practice in the most dynamic of industries at the turn of the century was not the rule of law but the rule of cliques of “robber barons” along with smaller time shady operators who manipulated the law to their own selfish ends with impunity (Starobin 2009). In 1859, the year Edwin Drake drilled the first oil well American production amounted to only 2,000 barrels. Ten years later it was 4.25 million and by 1900 American production would be nearly 60 million barrels. In 1870 a firm named Rockefeller, Flagler and Andrews formed a new corporation, Standard Oil. Capitalized at $1 million, at the time of its incorporation it owned 10 percent of the country’s oil refining capacity; by 1880 it would control 80 percent of a much larger industry. As Standard Oil tightened its grip on the oil industry prices dropped as the company hoped to maximize profits by increasing demand (Gordon 04: 256). When the Supreme Court ruled in, Wash Railway v. Illinois in 1886 that states had no power over railroads that were carrying goods across a state lines, the fight to regulate the railroads moved, to Washington. After a year of intense political wrangling Congress established the Interstate Commerce Commission that was strengthened in 1890 by the Sherman Antitrust Act whereby , “Every contract, combination in the form of trust or otherwise, or conspiracy, in restraint of trade or commerce among the several states, or with foreign nations, hereby declared to be illegal” furthermore making it a crime to “monopolize, or combine or conspire to monopolize any part of the trade or commerce among the several states” (Gordon 04: 238).
Monopoly grows out of the soil of free competition. There are three principal manifestations of monopoly capitalism. Firstly, monopoly arose out of the concentration of production at a very high stage. Secondly, monopolies have stimulated the seizure of the most important sources of raw materials, especially for the basic and most highly cartelised industries in capitalist society: the coal and iron industries. Thirdly, monopoly has sprung from the banks. The banks have developed from modest middleman enterprises into the monopolists of finance capital. Some three to five of the biggest banks in each of the foremost capitalist countries have achieved the “personal link-up” between industrial and bank capital, and have concentrated in their hands the control of thousands upon thousands of millions which form the greater part of the capital and income of entire countries. A financial oligarchy, which throws a close network of dependence relationships over all the economic and political institutions of present-day bourgeois society without exception—such is the most striking manifestation of this monopoly (Lenin 17). Although the monopolies were very competitive with the competition they had a consumer friendly corporate philosophy (1) innovate constantly and invest heavily in the latest equipment and technology to drive down operating costs (2) always be the low-cost producer so as to remain profitable in bad economic times (3) retain most of the profits in good times to take advantage of opportunities in the bad times as less efficient competitors fail (Gordon 04: 247-248).
The immediate post Civil War years
were, the golden age of American parties.
The veterans hadn’t yet forgotten how the Democratic Republican (DR)
parties had divided the country and brought war and devastation to millions of
people. Flush with industrial
contributions party regularity was higher, party loyalty deeper and party
stability greater than at any other time in American history (Schlesinger 99:
260). Third parties such as the Greenback
party in 1880, the Anti-Monopoly party in 1884, the Labor party in 1888 and the
Populist party in 1892 flourished (Schlesinger 99: 265). In the nineteenth century visiting Europeans
were awed by the popular obsession with politics. Tocqueville in the 1830s thought politics
“the only pleasure an American knows.”
Bryce half a century later found parties “organized far more elaborately
in the United States than anywhere else in the world.” Voting statistics justified transatlantic
awe. In no presidential election between
the Civil War and the end of the century did the American turnout, the
proportion of eligible voters actually voting, fall below 70 percent. In 1876 it reached nearly 82 percent. But in no presidential election since 1968
has the American turnout exceeded 55 percent.
In 1984, only 52.9 percent voted.
In the meantime, turnout in the once awed European democracies is over
75 percent in Great Britain and France, over 80 percent in west Germany, the
Low Countries and Scandinavia, over 90 percent in Italy. Currently the United States ranks twentieth
among twenty-one democracies in turnout as a percentage of the voting-age
population (only Switzerland is worse).
Fifty million additional American would have had to vote in 1984 to bring
turnout back to nineteenth-century levels (Schlesinger 99: 256)
Fig. 5.1 Voter Participation in
Presidential Elections 1824-2008
|
Year |
1824 |
1828 |
1832 |
1836 |
1840 |
1844 |
1848 |
1852 |
1856 |
1860 |
1864 |
1868 |
1872 |
1876 |
1880 |
1884 |
1888 |
1892 |
1896 |
|
Turnout |
26.9 |
57.6 |
55.4 |
57.8 |
80.2 |
78.9 |
72.7 |
69.6 |
78.9 |
81.2 |
73.8 |
78.1 |
71.3 |
81.8 |
79.4 |
77.5 |
79.3 |
74.7 |
79.3 |
|
Year |
1900 |
1904 |
1908 |
1912 |
1916 |
1920 |
1924 |
1928 |
1932 |
1936 |
1940 |
1944 |
1948 |
1952 |
1956 |
1960 |
1964 |
1968 |
1972 |
|
Turnout |
73.2 |
65.2 |
65.4 |
58.8 |
61.6 |
49.2 |
48.9 |
56.9 |
56.9 |
61.0 |
62.5 |
55.9 |
53.0 |
63.3 |
60.6 |
64.0 |
61.7 |
60.6 |
55.2 |
|
Year |
1976 |
1980 |
1984 |
1988 |
1992 |
1996 |
2000 |
2004 |
2008 |
|
|
|
|
|
|
|
|
|
|
|
Turnout |
53.6 |
52.6 |
53.1 |
50.1 |
55.1 |
49.1 |
51.3 |
55.3 |
56.8 |
|
|
|
|
|
|
|
|
|
|
Source: Series Y
27-78 Historical Statistics of the United States: Colonial Times
to 1970. Bicentennial Edition. Vol. 2. Pg. 1071-1072; Info-please National
Voter Turnout in Federal Elections 1960-2008
The gradual acceptance of the
view that education ought to be a responsibility of the state is the most significant
of the general trends of the nineteenth century. This trend began in Prussia in 1808, and in
France, under Napoleon, about the same time.
Britain was even later than the United States but finally in 1870, a
system of government schools was established, though elementary education was
not made compulsory until 1880 and fees were not generally abolished until
1891. In 1920 local funds made up 83
percent of all revenues of public schools, federal grants less than 1
percent. By 1940 the local share had
fallen to 68 percent. Currently it is
less than one half. The state provided
most of the rest of the money, 16 percent in 1920, 30 percent in 1940, and
currently more than 40 percent. The
federal government’s share is still small but growing rapidly, from less than 2
percent in 1940 to roughly 8 percent currently (Friedman 80: 155). At first
schools were private and attendance strictly voluntary. Increasingly, government came to play a
larger role, first by contributing to financial support, later by establishing
and administering government schools.
The fist compulsory attendance law was enacted by Massachusetts in 1852,
but attendance did not become compulsory in all states until 1918. Government control was primarily local until
well into the twentieth century. The
neighborhood school, and control by the local school board, was the rule
(Friedman 80: 150). In his report for
1836 the superintendant of common schools of the State of New York asserted,
“under any view of the subject it is reasonable to believe, that in the common
schools, private schools and academies, the number of children actually
receiving instruction is equal to the whole
number between five and sixteen years of age”. Beginning in the 1840s, a campaign developed
to replace the diverse and largely private system by a system of so-called free
schools, ie. schools in which parents and others paid the cost indirectly by
taxes rather than directly by fees (Friedman 80:155).
Because the United States had become very industrialized by the 1890s the depression that began in 1893 brought unparalleled hardships. In 1860 there had been four farm workers for every factory worker, but by 1890 the ratio had dropped to two to one. That meant that one American family in three was dependent on a regular paycheck for food, shelter and clothing (Gordon 04: 275). Limited government The Populists said in their 1892 platform, “We believe that powers of government, in other words, of the people, should be expanded, to the end that oppression injustice and poverty shall eventually cease in the land” (Schlesinger 99: 236). In the spring of 1893 the Philadelphia and Reading Railroad and the National Cordage Company declared themselves insolvent and panic swept Wall Street. By the end of that year some fifteen thousand companies had failed, along with 491 banks. The gross national product fell by 12 percent and unemployment rose rapidly from a mere 3 percent in 1892 to 18.4 percent two years later. While before the term “unemployed” had applied to anyone without an occupation in 1878 a Massachusetts survey had redefined the term unemployed to mean, “men over eighteen who were out of work and seeking it” (Gordon 04: 265).
When the great depression of 1893 struck and federal
revenues plummeted there was a renewed call for an income tax. With a Democrat, Grover Cleveland, in the
White House, and Democratic majorities in both houses of Congress, a new income
tax became law in 1894. It was a very
different tax in its impact than the Civil War income tax. The latter had exempted only the poor. The new tax, which called for a 2 percent tax
on all incomes more than $4,000, exempted all but the rich. Of the twelve million American households in
1894, only eighty-five thousand had incomes of $4,000 or more. That was well under 1 percent of all
households. Republicans opposed the tax
because it targeted a particular class of people, for that reason also
Cleveland allowed the bill to become a law without his signature. A case was immediately brought Pollack v.
Farmers’ Loan and Trust generated enormous interest around the country. Because of the intense public attention, the
Court agreed to a rehearing of the case and Justice Howell Jackson, who was
mortally ill, he died less than three months later, attended, undoubtedly
intent on being the fifth vote to uphold the tax, one of the other justices
switched sides, however, and the income tax ruled unconstitutional, five to
four (Gordon 04: 275).
In 1876 the Greenback Labor Party nominated a candidate for president, Peter Cooper of New York, paradoxically one of the richest men in the country, a “limousine liberal”, and in 1878 the party attracted 1,060,000 votes in congressional elections, enough to elect fourteen congressmen. The government had stopped printing greenbacks after the Civil War, started minting silver dollars and then stopped in 1873 and Congress voted to return to the gold standard on January 1, 1879 and the Treasury was required to maintain a gold reserve of $100 million to meet any demand for the precious metal. But when the crash of 1893 marked the onset of a new depression, the trickle of gold out of the Treasury rose to a flood. As government revenues plunged, they declined from $386 million to $306 million between 1893 and 1894, the government issued bonds to buy more gold to replenish the gold reserve, but the metal continued to flow out. Before long the Treasury gold reserve dipped below the $100 million required by law in 1894 and was replenished by the proceeds of a $50 million bond issue in January of that year. But it fell to just $68 million the following January. A week later it was down to $45 million. J.P. Morgan, by then the country’s undisputed leading banker, and the American representative of the Rothschild’s, promised President Grover Cleveland that they would raise $100 million in gold from Europe. In June 1895 the Treasury’s gold reserve stood at $107.5 million. Economic recovery had begun (Gordon 04: 268).
In the early years of the twentieth century the United States enjoyed prosperity beyond anything previously experienced. In the ten years between 1897 and 1907, American exports doubled, as did its imports. The amount of money in circulation, national banknotes and gold and silver coins, increased from $1.5 billion to $2.7 billion, while bank deposits soared from $1.6 billion to $4.3 billion, a figure larger than the GDP in 1860. The assets of banks, brokerage houses and insurance companies increased from $9.1 billion in 1897 to $21 billion ten years later. The United States had one-third of the world’s railroad mileage and 40 percent of its steel production. Ninety percent of the population was literate and supported more than twenty-two hundred newspapers. The country had a thousand colleges and universities and more high school students than any other on earth (Gordon 04: 281). The U.S. was the world’s greatest exporter of agricultural products. Its per capita income was far ahead of the next richest nation, Great Britain, which had dominated the world economy in the nineteenth century. The rest of the developed world was also enjoying great prosperity. The greatest engineering project in history the Panama Canal linked two oceans. But there was a problem. On the gold standard the economy could only grow as fast the gold supply that backed the world’s currencies. Gold production had stagnated in the 1880s, despite strikes in the Yukon and South Africa, by 1907 money markets were very tight (Gordon 04: 279).
On Monday, October 21, 1907, some
five months after the start of an economic recession, the Knickerbocker Trust
Company, the third largest trust company in New York City, began to experience
financial difficulties. The next day a
“run” on the bank forced it to close (temporarily, as it turned out; it resumed
business in March 1908). The closing of
the Knickerbocker Trust precipitated runs on other trust companies in New York
and then in other parts of the country a banking “panic” was under way of a
kind that had occurred every now and then during the nineteenth century. In
some state the government took measures that gave legal sanctions to the
restriction of payments, in the remaining state the practice was simply
tolerated and banks were permitted to stay open even though they were technically
violating the state banking laws (Friedman 80: 72). This dramatic episode was largely responsible
for the Federal Reserve Act of 1913. One
bank alone can meet a run by borrowing from other banks, or by asking its
borrowers to repay their loans. The borrowers
may be able to repay their loans by withdrawing cash from other banks. But if a bank run spreads widely, all banks
together cannot meet the run in this way.
There simply was not enough currency in bank vaults to meet a widespread
run (Friedman 80: 72-73).
When Theodore Roosevelt became president in 1901 on the assassination of William McKinley, he had moved sharply in the direction of the progressive wing of his party. In 1906 he even advocated a tax on inheritances. Taft, a far more conservative man than Roosevelt, revered the Supreme Court. Indeed he would serve as chief justice, an office far more congenial to his nature than the presidency, for most of the 1920s. He was horrified at the idea of defying the Supreme Court so he proposed the idea of a constitutional amendment that would permit an income tax and proposed a corporate income tax on profits. In 1911 the Supreme Court agree unanimously. The Sixteenth Amendment, meanwhile passed the Senate 77-0 and the House 318-14. The amendment was ratified by the required number of state legislatures and was declared effective on February 3, 1913. By that time the Republican Party had split between the conservative Taft Republicans and the progressive Roosevelt Republicans, who stormed out of the 1912 convention to form their own party under the symbol of the bull moose. As a result, the Democrat Woodrow Wilson was elected president with less than 42 percent of the popular vote but with almost 82 percent of the electoral votes (Gordon 04: 271). Among the first acts of the new Wilson administration was the passage of a personal income tax law. Although only fourteen pages long, it contained the seeds of the vast complexity that was to come. Income more than $3,000 was to be taxed, on a progressive scale from 1 to 7 percent (on incomes more than $500,000. But there were many exemptions, such as interest on state and local bonds and corporate dividends up to $20,000. Interest on all debts, depreciation of property, and many other things were deductible from taxable income. The corporate income tax remained a completely separate tax. The financial exigencies of the twentieth century’s great wars would send income tax rates soaring to heights undreamed of by even its most passionate advocates (Gordon 04: 277). Justice Oliver Holmes said, “Taxes are the price we pay for civilization.”
Fig. 5.3 Federal Income Tax First and
Top Bracket Rates 1913-2008
|
|
1st Bracket Rate |
1st Bracket Income up to |
Top Bracket Rate |
Top Bracket Income over |
Total Individual Income Tax Revenues In millions |
|
1913 |
1 |
20,000 |
7 |
500,000 |
|
|
1914 |
1 |
20,000 |
7 |
500,000 |
|
|
1915 |
1 |
20,000 |
7 |
500,000 |
|
|
1916 |
2 |
20,000 |
15 |
2,000,000 |
|
|
1917 |
2 |
2,000 |
67 |
2,000,000 |
|
|
1918 |
6 |
4,000 |
77 |
1,000,000 |
|
|
1919 |
4 |
4,000 |
73 |
1,000,000 |
|
|
1920 |
4 |
4,000 |
73 |
1,000,000 |
|
|
1921 |
4 |
4,000 |
73 |
1,000,000 |
|
|
1922 |
4 |
4,000 |
56 |
200,000 |
|
|
1923 |
3 |
4,000 |
56 |
200,000 |
|
|
1924 |
1.5 |
4,000 |
46 |
500,000 |
|
|
1925 |
1.5 |
4,000 |
25 |
100,000 |
|
|
1926 |
1.5 |
4,000 |
25 |
100,000 |
|
|
1927 |
1.5 |
4,000 |
25 |
100,000 |
|
|
1928 |
1.5 |
4,000 |
25 |
100,000 |
|
|
1929 |
3/8 |
4,000 |
24 |
100,000 |
|
|
1930 |
1 1/8 |
4,000 |
35 |
100,000 |
|
|
1931 |
1 1/8 |
4,000 |
35 |
100,000 |
|
|
1932 |
4 |
4,000 |
63 |
1,000,000 |
|
|
1933 |
4 |
4,000 |
63 |
1,000,000 |
|
|
1934 |
4 |
4,000 |
63 |
1,000,000 |
420 |
|
1935 |
4 |
4,000 |
63 |
1,000,000 |
527 |
|
1936 |
4 |
4,000 |
79 |
5,000,000 |
674 |
|
1937 |
4 |
4,000 |
79 |
5,000,000 |
1,092 |
|
1938 |
4 |
4,000 |
79 |
5,000,000 |
1,286 |
|
1939 |
4 |
4,000 |
79 |
5,000,000 |
1,029 |
|
1940 |
4.4 |
4,000 |
81.1 |
5,000,000 |
892 |
|
1941 |
10 |
2,000 |
81 |
5,000,000 |
1,314 |
|
1942 |
19 |
2,000 |
88 |
200,000 |
3,263 |
|
1943 |
19 |
2,000 |
88 |
200,000 |
6,505 |
|
1944 |
23 |
2,000 |
94 |
200,000 |
19,705 |
|
1945 |
23 |
2,000 |
94 |
200,000 |
18,372 |
|
1946 |
19 |
2,000 |
86.45 |
200,000 |
16,098 |
|
1947 |
19 |
2,000 |
86.45 |
200,000 |
17,935 |
|
1948 |
16.6 |
2,000 |
82.13 |
200,000 |
19,315 |
|
1949 |
16.6 |
2,000 |
82.13 |
200,000 |
15,552 |
|
1950 |
17.4 |
2,000 |
84.36 |
200,000 |
15,755 |
|
1951 |
20.4 |
2,000 |
91 |
200,000 |
21,616 |
|
1952 |
22.2 |
2,000 |
92 |
200,000 |
27,934 |
|
1953 |
22.2 |
2,000 |
92 |
200,000 |
29,816 |
|
1954-63 |
20 |
2,000 |
91 |
200,000 |
29,542 |
|
1955 |
20 |
2,000 |
91 |
200,000 |
28,748 |
|
1956 |
20 |
2,000 |
91 |
200,000 |
32,188 |
|
1957 |
20 |
2,000 |
91 |
200,000 |
35,620 |
|
1958 |
20 |
2,000 |
91 |
200,000 |
34,724 |
|
1959 |
20 |
2,000 |
91 |
200,000 |
36,719 |
|
1960 |
20 |
2,000 |
91 |
200,000 |
40,715 |
|
1961 |
20 |
2,000 |
91 |
200,000 |
41,338 |
|
1962 |
20 |
2,000 |
91 |
200,000 |
45,571 |
|
1963 |
20 |
2,000 |
91 |
200,000 |
47,588 |
|
1964 |
16 |
500 |
77 |
200,000 |
48,697 |
|
1965 |
14 |
500 |
70 |
100,000 |
48,792 |
|
1966 |
14 |
500 |
70 |
100,000 |
55,446 |
|
1967 |
14 |
500 |
70 |
100,000 |
61,526 |
|
1968 |
14 |
500 |
75.25 |
100,000 |
68,726 |
|
1969 |
14 |
500 |
77 |
100,000 |
87,249 |
|
1970 |
14 |
500 |
71.75 |
100,000 |
90,412 |
|
1971 |
14 |
1,000 |
70 |
200,000 |
86,230 |
|
1972 |
14 |
1,000 |
70 |
200,000 |
94,737 |
|
1973 |
14 |
1,000 |
70 |
200,000 |
103,246 |
|
1974 |
14 |
1,000 |
70 |
200,000 |
118,952 |
|
1975 |
14 |
1,000 |
70 |
200,000 |
122,386 |
|
1976 |
14 |
1,000 |
70 |
200,000 |
131,603 |
|
1977 |
14 |
1,000 |
70 |
200,000 |
157,626 |
|
1978 |
14 |
1,000 |
70 |
200,000 |
180,988 |
|
1979 |
14 |
2,100 |
70 |
212,000 |
217,841 |
|
1980 |
14 |
2,100 |
70 |
212,000 |
244,069 |
|
1981 |
13.825 |
2,100 |
69.125 |
212,000 |
285,917 |
|
1982 |
12 |
2,100 |
50 |
106,000 |
297,744 |
|
1983 |
11 |
2,100 |
50 |
106,000 |
288,938 |
|
1984 |
11 |
2,100 |
50 |
159,000 |
298,415 |
|
1985 |
11 |
2,180 |
50 |
165,480 |
334,531 |
|
1986 |
11 |
2,270 |
50 |
171,580 |
348,951 |
|
1987 |
11 |
3,000 |
38.5 |
90,000 |
392,557 |
|
1988 |
15 |
29,750 |
28 |
29,750 |
401,181 |
|
1989 |
15 |
30,950 |
28 |
30,950 |
445,690 |
|
1990 |
15 |
32,450 |
28 |
32,450 |
466,884 |
|
1991 |
15 |
34,000 |
31 |
82,150 |
467,827 |
|
1992 |
15 |
35,800 |
31 |
86,500 |
475,964 |
|
1993 |
15 |
36,900 |
39.6 |
250,000 |
509,680 |
|
1994 |
15 |
38,000 |
39.6 |
250,000 |
543,055 |
|
1995 |
15 |
39,000 |
39.6 |
256,500 |
590,244 |
|
1996 |
15 |
40,100 |
39.6 |
263,750 |
656,417 |
|
1997 |
15 |
41,200 |
39.6 |
271,050 |
737,466 |
|
1998 |
15 |
42,350 |
39.6 |
278,450 |
828,586 |
|
1999 |
15 |
43,050 |
39.6 |
283,150 |
879,480 |
|
2000 |
15 |
43,850 |
39.6 |
288,350 |
1,004,462 |
|
2001 |
15 |
45,200 |
39.1 |
297,350 |
994,339 |
|
2002 |
10 |
12,000 |
38.6 |
307,050 |
858,345 |
|
2003 |
10 |
14,000 |
35.0 |
311,950 |
793,699 |
|
2004 |
10 |
14,300 |
35.0 |
319,100 |
808,959 |
|
2005 |
10 |
14,600 |
35.0 |
326,450 |
927,222 |
|
2006 |
10 |
15,100 |
35.0 |
336,550 |
1,043,908 |
|
2007 |
10 |
15,650 |
35.0 |
349,700 |
1,163,472 |
|
2008 |
10 |
16,050 |
35.0 |
357,700 |
1,145,747 |
Sources: National Taxpayers Union History of
Federal Individual Income Tax Bottom and Top Bracket Rates 1913-2008; Table
VIII Series Y 440-456 Historical Statistics of the United
States: Colonial Times to 1970. Bicentennial Edition. Vol. 2. Pg. 1095. OMB
Historical Table 2.1 Receipts by Source
In nineteenth
century America elderly people faced four alternatives: live on savings, move
in with children, subsist on the crumbs of private and public charity or keep
on working (Katz 01: 232). The federal
government operated a massive pension program for Civil War veterans. Congress granted the first Civil War pensions
to veterans in 1862 and in 1890 it expanded pension eligibility to any veteran
who had served at least ninety days, regardless of combat experience or injury,
or to his dependents. The qualifying
condition, instead, was the inability to perform manual labor, usually defined
by age. A 1906 amendment labeled age sixty
two the commencement of “permanent specific disability”. As a result, at least one of every two
elderly, native-born Northern white mend and many of their widows received
pensions from the federal government.
Veteran’s pensions became the largest item in the federal budget after
the national debt. Pressure for a new
form of old-age assistance surfaced after about 1910, as Civil War veterans and
their dependents began to die (Katz 01: 233).
The earliest American proposals for health insurance focused on the link
between sickness and poverty. When the
agents employed by Charity Organization Societies set out to investigate
applicants for relief in the latter decades of the nineteenth century, they
found illness implicated over and over again in destitution. This link between poverty and sickness is the
reason why early American health insurance proposals focused on assuring some
income during periods of illness, what today we would call disability
insurance. (Katz 01: 257).
Social insurance
originated in Germany. Bismarck
introduced sickness insurance in 1883, workers’ compensation in 1884 and old
age insurance in 1889. Germany’s first
unemployment insurance began in 1927. As
a conservative, Bismarck intended social insurance to bind workers to the state
and preserve social order. In England,
social insurance started a little later: worker’s compensation in 1897, old age
in 1908, and sickness and unemployment in 1911.
In the United States, some state governments pioneered social insurance
in the years between 1911 and 1930s; Veteran’s Pensions was the only federal
program. But in contrast to Europe after
World War II, where national social insurance programs developed into a
relatively universal and unified system, America’s social insurance structure
remained rickety, incomplete, and poorly coordinated; it was part national and
part state, and it left whole categories of individuals without guaranteed
protection, dependent on public or private charity (Katz 01: 196). In both
American and Europe, worries about the impact of social insurance, as well as
of relief, charity and welfare, on labor markets have always retarded the
development of public programs to reduce risks and relieve poverty. The question asked again and again has been,
do they erode the will to work? The
disincentives thought to result from social insurance and relief are what
economists label “moral hazard”” (Katz 01: 196). After the Democrats took control of the House
of Representatives in 1910, Congress finally passed a bill creating a Cabinet
level department to “promote and develop the welfare of the wage earners of the
United States, to improve their working conditions, and to advance their
opportunities for profitable employment”.
William Howard Taft grudgingly signed the bill into law on March 4,
1913, the final day of his presidency (Cohen 09: 195).
Fig. 5.4 Foreign Born and Native Population in the United States 1950-1990
|
Year 1/ |
Total |
Native population |
Foreign- |
||||
|
Total |
Born in the |
Born abroad |
|||||
|
Total |
In |
Of |
|||||
|
NUMBER |
|
|
|
|
|
|
|
|
1990* |
248,709,873 |
228,942,557 |
225,695,826 |
3,246,731 |
1,382,446 |
1,864,285 |
19,767,316 |
|
1980* |
226,545,805 |
212,465,899 |
210,322,697 |
2,143,202 |
1,088,172 |
1,055,030 |
14,079,906 |
|
1970* |
203,210,158 |
193,590,856 |
191,329,489 |
2,261,367 |
891,266 |
1,370,101 |
9,619,302 |
|
1960* |
179,325,671 |
169,587,580 |
168,525,645 |
1,061,935 |
660,425 |
401,510 |
9,738,091 |
|
1950* |
150,216,110 |
139,868,715 |
139,442,390 |
426,325 |
329,970 |
96,355 |
10,347,395 |
|
1940 |
131,669,275 |
120,074,379 |
119,795,254 |
279,125 |
156,956 |
122,169 |
11,594,896 |
|
1930 |
122,775,046 |
108,570,897 |
108,304,188 |
266,709 |
136,032 |
130,677 |
14,204,149 |
|
1920 |
105,710,620 |
91,789,928 |
91,659,045 |
130,883 |
38,020 |
92,863 |
13,920,692 |
|
1910 |
91,972,266 |
78,456,380 |
78,381,104 |
75,276 |
7,365 |
67,911 |
13,515,886 |
|
1900 |
75,994,575 |
65,653,299 |
65,583,225 |
70,074 |
2,923 |
67,151 |
10,341,276 |
|
1890 |
62,622,250 |
53,372,703 |
53,362,371 |
10,332 |
322 |
10,010 |
9,249,547 |
|
1880 |
50,155,783 |
43,475,840 |
43,475,498 |
342 |
51 |
291 |
6,679,943 |
|
1870 |
38,558,371 |
32,991,142 |
32,990,922 |
220 |
51 |
169 |
5,567,229 |
|
1860 |
31,443,321 |
27,304,624 |
27,304,624 |
- |
- |
- |
4,138,697 |
|
1850 |
23,191,876 |
20,947,274 |
20,947,274 |
- |
- |
- |
2,244,602 |
|
PERCENT |
|
|
|
|
|
|
|
|
1990* |
100.0 |
92.1 |
90.7 |
1.3 |
0.6 |
0.7 |
7.9 |
|
1980* |
100.0 |
93.8 |
92.8 |
0.9 |
0.5 |
0.5 |
6.2 |
|
1970* |
100.0 |
95.3 |
94.2 |
1.1 |
0.4 |
0.7 |
4.7 |
|
1960* |
100.0 |
94.6 |
94.0 |
0.6 |
0.4 |
0.2 |
5.4 |
|
1950* |
100.0 |
93.1 |
92.8 |
0.3 |
0.2 |
0.1 |
6.9 |
|
1940 |
100.0 |
91.2 |
91.0 |
0.2 |
0.1 |
0.1 |
8.8 |
|
1930 |
100.0 |
88.4 |
88.2 |
0.2 |
0.1 |
0.1 |
11.6 |
|
1920 |
100.0 |
86.8 |
86.7 |
0.1 |
- |
0.1 |
13.2 |
|
1910 |
100.0 |
85.3 |
85.2 |
0.1 |
- |
0.1 |
14.7 |
|
1900 |
100.0 |
86.4 |
86.3 |
0.1 |
- |
0.1 |
13.6 |
|
1890 |
100.0 |
85.2 |
85.2 |
- |
- |
- |
14.8 |
|
1880 |
100.0 |
86.7 |
86.7 |
- |
- |
- |
13.3 |
|
1870 |
100.0 |
85.6 |
85.6 |
- |
- |
- |
14.4 |
|
1860 |
100.0 |
86.8 |
86.8 |
- |
- |
- |
13.2 |
|
1850 |
100.0 |
90.3 |
90.3 |
- |
- |
- |
9.7 |
Source: Historical Census Statistics on the Foreign-born Population of the United States: 1850-1990
During the latter half of the
nineteenth century the United States was a beacon of hope for people, mostly
from Eastern Europe. Millions of people
eager for opportunity and fleeing persecution in the Old World flocked to
American shores. The 1850 decennial
census was the first census in which data were collected on the nativity of the
population. From 1850 to 1930, the foreign-born population of the United States
increased from 2.2 million to 14.2 million, reflecting large-scale immigration
from Europe during most of this period.
As a percentage of total population, the foreign-born population rose
from 9.7 percent in 1850 and fluctuated in the 13 percent to 15 percent range
from 1860 to 1920 before dropping to 11.6 percent in 1930. The highest
percentages foreign born were 14.4 percent in 1870, 14.8 percent in 1890 and
14.7 percent in 1910. From 1930 to 1950,
the foreign-born population of the United States declined from 14.2 million to
10.3 million, or from 11.6 percent to 6.9 percent of the total population.
These declines reflected the extremely low level of immigration during the
1930s and 1940s. The foreign-born population then dropped slowly to 9.6 million
in 1970, when it represented a record low 4.7 percent of the total population.
Immigration had risen during the 1950s and 1960s, but was still low by
historical standards, and mortality was high during this period among the
foreign-born population because of its old age structure (reflecting four
decades of low immigration). Since 1970,
the foreign-born population of the United States has increased rapidly due to
large-scale immigration, primarily from Latin America and Asia. The
foreign-born population rose from 9.6 million in 1970 to 14.1 million in 1980
and to 19.8 million in 1990. The estimated foreign-born population in 1997 was
25.8 million. As a percentage of the total population, the foreign-born
population increased from 4.7 percent in 1970 to 6.2 percent in 1980, to 7.9
percent in 1990, and to an estimated 9.7 percent in 1997 (Gibson, Lennon 99).
Backed by J.P. Morgan it took six years of intricate negotiations to get a political agreement on the creation of the Federal Reserve System. All national banks were required to be members of the new central banking system, and state banks that could meet the capital requirements of national banks, were eligible for membership as well. The advantage of membership, of course, was that in a panic, member banks could use their loan portfolios as collateral to obtain cash in a hurry from the Federal Reserve. The downside of membership was a new layer of regulation added to, rather than replacing, the older regulatory bodies, such as the Comptroller of the Currency. The new Federal Reserve System came into existence in 1913, and the United States had a central bank, for the first time since Andrew Jackson had been president. J.P. Morgan, the country’s de factor central banker in much of the post-Civil War era, had been born in 1836, the same year as the charter of the Second Bank of the United States expired and he died the same year the Federal Reserve, its long needed replacement, was born in 1913 (Gordon 04: 281). The Federal Reserve System started to operate in late 1914, a few months after the outbreak of war in Europe. By the end of the war the United States had replaced Britain as the center of the financial world. The Federal Reserve Banks bought bonds from the U.S. Treasury and paid for them with Federal Reserve Notes that the Treasury could pay out to meet some of its expenses. But mostly the Fed paid for bonds it bought by crediting the Treasury with deposits at the Federal Reserve Banks. When the recipients deposited the checks in their own banks and these banks in turn deposited them at a Federal Reserve Bank, the Treasury deposits at the Fed were transferred to the commercial banks, increasing their reserves. The subtlety of the process whereby the quantity of money was increased did not prevent inflation, but it did smooth the operation and, by concealing what was actually happening, lessen or postpone the public’s fears about inflation (Friedman 80:78).
Automobiles and
electricity became commonplace. German
Nickolaus Otto had built the first practical internal combustion engine in 1876
and Wilhelm Maybach, also German, invented the carburetor in 1893. In 1903 alone, fifty-seven automobile
companies came into existence in the United States and twenty-seven-seven went
bankrupt. Today there are no more than
two dozen automobile companies, all of them necessarily multibillion-dollar
corporations, in the world. In 1903
Henry Ford opened the Ford Motor Company, that introduced the Model T in
1908. At $850 a piece the public bought
10,607 that year, the price later dropped to $265 in by the 1920s some 1.9
million cares rolled off assembly lines and 8.1 million vehicles were in
registration. By the 1920s the
automobile industry had become the largest in the American economy. The seemingly insatiable national appetite
for cars produced a decade of great industrial prosperity. GNP increased by 59 percent between 1921 and
1923 reaching $103.1 billion. Meanwhile,
GNP per capita rose by 42 percent and personal income by more than 38
percent. By 1929 production was up to
4.5 million cars, and 23.1 million had been registered (Gordon 04: 298). The automobile also greatly increased road
building, from hardly any paved roads in 1900, by 1920 there were 369,000 miles
and by 1929 there were 662,000 miles (Gordon 04: 299).
Although Benjamin Franklin experimented with lightning electricity in the18th century and in 1831 Michael Faraday proved the identity of electricity and magnetism and produced the first practical use of electricity – the telegraph – it was not until the end of the century that electricity began to impact on everyday life. In his Menlo Park laboratory Thomas Edison invented the phonograph (1877), the electric light (1879) and hundreds of other inventions. When General Electric was formed in 1892 by J.P. Morgan from the Edison General Electric Company and its major competitors there was need for power plants. Edison built the world’s first power plant and installed six of the largest dynamos yet built, weighing thirty tons each. Edison applied for no less than 102 patents in 1882, his most prolific year. Electricity spread through the business districts and fashionable residential areas, but remained expensive, it cost about 1 cent an hour to light a single bulb, and meters monitoring usage were invented. In 1902 the United States used 6 billion kilowatt-hours of electricity about 79 kilowatt-hours per person. In 1929 it was 118 billion, and 960 kilowatt-hours per person. Today the usage is a staggering 3.9 trillion kilowatt hours, more than 13,500 per person, more than 170 times as much electricity as was used per person in 1902 (Gordon 04: 306-307).
The twentieth century didn’t really begin until August 1, 1914. As the threat of war became ever greater in the last day of July 1914, stock markets the world over panicked while the demand for gold soared. On Tuesday, July 28, unable to maintain orderly markets, the exchanges in Vienna, Rome and Berlin closed. The net day volume on the New York Stock Exchange reached 1.3 million shares, its highest since the panic of 1907 and many stocks fell more than 20 percent. On Friday July 31, the London Stock Exchange closed and the New York Stock Exchange was the only one scheduled to open but J.P Morgan and the Secretary of Treasury William Gibbs McAdoo decided to close the exchange until further notice. It would not be until December before the exchange reopened and then on a limited basis. At first American commerce was severely disrupted. Cotton exports declined sharply and so did wheat. Germany had imported 2.6 million bushels of wheat in July, but none in August, as the Royal Navy asserted its sea power (Gordon 04: 287). Soon however the situation reversed and American exports of agricultural products increased quickly. Between December 1913 and 1914 the U.S. exported a total of eighteen million bushels of wheat, a year later wheat exports amounted to ninety-eight million bushels. As the war dragged on more and more agricultural workers were called into service but agricultural exports continued to increase, net farm income in the war years more than doubled, to $10 billion and the value of agricultural lands, buildings and equipment rose nearly 30 percent (Gordon 04: 288).
American manufacturing also increased rapidly as the result of the World War in Europe. Markets in Latin American and Asia, which had been served by European companies, were now open to be taken over by American firms. Far more important was the avalanche of order that began to roll in to American firms form Great Britain and its allies, for steel, vehicles, railroad rolling stock and rails, and a new invention barbed wire. Munitions were of course n the greatest demand. Du Pont had been only a midsized manufacturer of gunpowder before the war, but would come to supply the Allies with fully 40 percent of their munitions. In the four years of war Du Pont’s military business increased by a factor of 276 and it became one of the world’s largest chemical companies as well. By the end of the war Du Pont had revenues twenty-six times as large as they had been in 1913 (Gordon 04: 292). Overall the gross national product of the United States increased by 21 percent in the four years of the war, while manufacturing increased by 25 percent (Gordon 04: 289).
The war’s effect on federal finances was both great and permanent, just as the civil War’s had been. Since 1865 the government had never spent more in one year than the $746 million it had spent in 1915. The national debt that year was a mere $1.191 billion, John D. Rockefeller could have paid it off himself and still been the richest man in the country. After the First World War, however, annual government outlays were never less than $2.9 billion and the national debt rose to more than $25 billion in 1919. The personal exemption from the income tax dropped to $1,000 from $3,000 and the tax rate on incomes more than $500,000 rose from 7 percent to 77 percent. The income tax thus became the primary source of federal revenues and has remained so ever since (Gordon 04: 292). Even as late as 1914 the United States remained the world’s largest debtor nation, with investments abroad that equaled $3.5 billion and European investment in the United States worth $7.2 billion. By the end of the war, the situation had nearly reversed, with foreigners holding $3.3 billion in American securities and Americans owning foreign investments of $7 billion. In addition foreign governments, principally France and Britain, owed the United States government $9.6 billion in war loans. Thus in four years, the United States had gone from being a net debtor, owing $3.7 billion, to being a net creditor that was owed a total of $12.6 billion. While the United States had military deaths amounting to 126,000 in the First World War, France, with a population of less than 40 million had lost 1,357,000 young men, the British Empire 908,000, Germany 1,773,000, Austria 1,200,000 and Russia 1,700,000 (Gordon 04: 293).
|
|
1902 |
1913 |
1922 |
1927 |
1932 |
1934 |
|
Total |
653 |
962 |
4,261 |
4,469 |
2,634 |
3,886 |
|
Income Tax |
n/a |
|
1,931 |
879 |
405 |
405 |
|
Corporate Tax |
n/a |
35 |
“ |
1,259 |
598 |
386 |
|
Customs Duties |
243 |
310 |
318 |
585 |
311 |
299 |
|
Alcohol Excise |
187 |
223 |
44 |
20 |
8 |
248 |
|
Tobacco Excise |
49 |
77 |
270 |
375 |
398 |
424 |
|
Other Excise Tax |
8 |
2 |
520 |
107 |
16 |
708 |
|
Death and Gift |
5 |
n/a |
139 |
90 |
41 |
110 |
|
Other Taxes |
21 |
21 |
142 |
47 |
36 |
164 |
Source: Y 567- 589 Historical Statistics of the United States: Colonial Times to 1970. Bicentennial Edition. Vol. 2. Pg. 1122
The Consumer Price Index nearly doubled
between 1915 and 1920. A third of total
wartime inflation occurred after the end not only of the war but also of
government deficits to pay for the war (Friedman 80: 77). The Federal Reserve had kept interest rates
low during the war to facilitate the government’s borrowing needs, and
maintained those rates until November 1919 after the passage of the XIX
Amendment prohibited alcohol. Then the
Fed moved the rediscount rate in a series of abrupt steps from 4 percent to 7
percent over the next eight months. The
economy had been moving towards another recession with the end of vast military
orders and the revival of European agriculture.
The Federal Reserve’s actions turned a decline into a near
disaster. The money supply contracted by
9 percent, while unemployment shot up from 4 to 12 percent. GNP declined by nearly 10 percent. But at least the Federal Reserve’s
overcorrection broke the back of the wartime inflation and wholesale prices
declined by nearly 40 percent between 1920 and 1921. Fortunately the depression of 1920-21 proved
to be short lived (Gordon 04: 295).
“The reign of tears is over. The
slums will be only a memory. We will
turn our prisons into factories and our jails into storehouses and
corncribs. Men will walk upright now, women
will smile, and the children will laugh.
Hell will be forever for rent.”
That is how Billy Sunday, noted evangelist and leading crusader against
Demon Rum, greeted the onset of Prohibition in 1920, enacted in a burst of
moral righteousness at the end of the First World War. New prisons and jails had to be built to
house the criminals spawned by converting the drinking of spirits into a crime
against the state. Al Capone, budget
Moran became notorious for their exploits, murder, extortion, hijacking,
bootlegging. But in order for the people
to have a drink, they had to break the law.
Prohibition didn’t stop drinking.
It did convert a lot of otherwise law-obedient citizens into lawbreakers
(Friedman 80: 226).
After the war the Federal Reserve System continued to increase the quantity of money rapidly, thereby feeding the inflation. At this stage, however, the additional money was being used not to pay for the government’s expenses but to finance private business activities. Ironically the banks that most needed discipline and protection against runs were the very banks that did not join the system, the small, stand-alone banks. By 1920 these fragile vessels holding the liquid assets of millions of American families and businesses would number almost thirty thousand (Gordon 04: 281). There were an astonishing number of local banks peaking at 29,798 in 1921, almost all of them one-branch outfits with assets under a million dollars, and which were not members of the Federal Reserve. The number of bank failures in the United States in the 1920s despite the general prosperity, began to increase. By the end of the decade, more than six hundred rural banks a year were failing, often taking the savings of their customers with them (Gordon 04: 301). Much of the success during the twenties can be credited to Benjamin Strong, a New York banker who was the first head of the Federal Reserve Bank of New York and remained its head until his untimely death in 1928. Until he died, the New York Bank was the prime mover in Federal Reserve policy both at home and abroad. Strong’s death unleashed a struggle for power within the System that was fated to have far-reaching consequences. As Strong’s biographer puts it, “Strong’s death left the System with no center of enterprising and acceptable leadership” (Friedman 80: 78).
By the end of the First World War the United States had
become financially as well as economically the strongest country in the
world. It was the world’s greatest
creditor nation, and its share of the world’s manufacturing increased from 36
percent in 1914 to 42 percent by the end of the 1920s. But Woodrow Wilson was outmaneuvered at the
Versailles Peace Conference and a draconian, merciless peace was imposed on
Germany, requiring it to pay vast war reparations to the victors, but not the
United States which demanded no reparations.
Britain, France and Italy were saddled with huge war debts to the United
States, which they had scant means to pay and the United States had scant
interest in forgiving. Further, the
United States was determined to maintain a high tariff to protect American
producers and to have a favorable balance of trade. Meanwhile the Federal Reserve returned to a
policy of low interest rates while European central banks maintained high ones
to protect the value of their currencies.
The result was that American investment banks pushed highly profitable
loans and underwritings in Europe.
Europe used the proceeds to finance imports from the United States, and
Germany used them to fund reparations to the Allied Powers. The Allied Powers then used the reparations
to repay their war loans to the United States (Gordon 04: 311). The First World War cost Europe the deaths of 8.5 million
soldiers and 5 million civilians. The
elite of European society – including half of the men in France between the
ages of twenty and thirty-two – went to their graves. In geopolitical terms the only “winner” to
emerge from this bloodbath was the United States who suffered some 115,000
military deaths, about a fifth of the toll of the Civil War. Otto von Bismarck’s unification of Germany
spurred fantasies of a German century but what occurred was an American century
(Gordon 04: 313).
Between 1910 and
1920 only about 21 large firms a year started pension plans, in the 1920s the
number rose to about 45. By 1925 over
200 firms, led by the railroads, which dominated the expansion of private
pensions, offered them. In 1929 fewer
than 4 percent of men employed in industry and fewer than 3 percent of women
had worked long enough at a single firm to qualify. The benefits themselves remained insecure,
subject to reduction or elimination and unprotected from inflation. Chicago introduced the first teachers’
pensions in 1895, no other cities followed for fifteen years, then between 1911
and 1915 the number multiplied rapidly.
By the late 1920s retirement funds for policemen, teachers and firemen
had become nearly universal.
Nonetheless, as of 1932, only about 15 percent of American workers were
eligible for them. In 1921 the national
government gave employers tax exemptions for contributions to trust funds
designed to accumulate and distribute capital for fringe benefits. Treasury rulings in 1914 and 1921 allowed
businesses to deduct pension expenses from the recently enacted income
tax. The 1926 Revenue Act wrote these
administrative rulings into law. The
federal government had begun to subsidize social welfare before the New Deal
(Katz 01: 172). To aggravate the restraints
on trade imposed by Prohibition the codification of Title 22 of the United
States Code Foreign Relations (a-FraI-d) without regards for the obscenity, in
regards to the invention of can-sir from XIX Amendment tobacco, or abuse of
power and appointment of J. Edgar Hoover, Director the Bureau of
Investigations, later FBI, both in 1924, were subversive to the economic policy
of the Federal Reserve (FR-ee), secretly catalyzed the Great Depression and in
some shape or form all subsequent economic crisis.
In 1928 American investment bankers began increasingly to turn to a market even more lucrative than European loans, the call money market on Wall Street. Call money was the term for the funds used to finance stocks held on margin. Speculators could buy stocks on as little as 10 percent margin, borrowing the rest from the broker. As long as the stock, which served as collateral for the loan, was headed upward, all was fine, and the speculator could increase his capital very quickly, but if the stock price declined, he had to put up more money or he would be sold, often wiping him out. The call money market was very lucrative in the late 1920s and while the GNP increased by 59 percent the Dow Jones went up by 400 percent. In 1928 the Federal Reserve acted to slow down the economy and the boom on Wall Street, which was showing signs of getting out of hand. Benjamin Strong head of the New York Federal Reserve raised its discount rate to 5 percent from 3.5 percent and then in the fall of 1928 died of complications from tuberculosis. On September 3, the day after Labor Day the New York Stock Exchange closed at an all time high. Over the next six weeks the market trended downward. Then on October 23, selling swept the market and on Thursday, October 24 soon known as Black Thursday, was the most frantic day in the history of the exchange and stocks plunged. Then on Black Tuesday, October 29 the market plunged from the opening bell and kept plunging and at the end of the day stood at 23 percent below where it had closed on Saturday and nearly 40 percent below its high of early September (Gordon 04: 315-316).
Fig.
7.1 Depression's impact on the economy 1929 and 1933
|
|
1929 |
1933 |
|
Banks in operation |
25,568 |
14,771 |
|
Prime interest rate |
5.03% |
0.63% |
|
Volume of stocks sold (NYSE) |
1.1 B |
0.65 B |
|
Privately earned income |
$45.5B |
$23.9B |
|
Personal and corporate savings |
$15.3B |
$2.3B |
Source: Historical Statistics of the United States, pp. 235, 263, 1001, and 1007
The depression that started in
mid-1929 was a catastrophe of unprecedented dimensions for the United
States. The dollar income of the nation
was cut in half before the economy hit bottom in 1933. Total output fell by a third, and
unemployment reached the unprecedented level of 25 percent of the work
force. The depression was no less a
catastrophe for the rest of the world.
As it spread to other countries, it brought lower output, higher
unemployment, hunger, and misery everywhere (Friedman 80: 70). The popular view is that the depression
started on Black Thursday, October 24, 1929, when the New York stock market
collapsed. After several intermediate
ups and downs, the market ended up in 1933 at about one-sixth the dizzying
level of 1929. The stock market crash
was important, but it was not the beginning of the depression. Business activity
reached its peak in August 1929, two months before the stock market
crashed. The crash reflected the growing
economic difficulties plus the puncturing of an unsustainable speculative
bubble. With Strong dead, from tuberculosis,
the Board wanted to establish its leadership.
It moved rapidly to impose its discipline on New York, and New York
yielded. Thereafter the System acted
very differently than it had during earlier economic recessions in the 1920s.
Instead of actively expanding the money supply by more than the usual amount to
offset the contraction, the System allowed the quantity of money to decline
slowly throughout 1930 (Friedman 80: 79).
Compared with the decline of roughly one-third in the quantity of money
from late 1930 to early 1933, the decline in the quantity of money up to
October 1930 seems mild, a mere 2.6 percent (Friedman 80: 79).
The character of the recession
changed dramatically when a series of bank failures in the Middle West and
South undermined confidence in banks and led to widespread attempts to convert
deposits into currency. The contagion
finally spread to New York, the financial center of the country (Friedman 80:
80). The critical date is December 11,
1930 when the Bank of United States closed its doors. It ended up paying off depositors 83.5 cents
on the dollar (Friedman 80: 81). Two of the owners were tried, convicted and
served prison sentences. Banks failed in
droves, 352 banks in the month of December 1930 alone. Had the Federal Reserve never been
established, and had a similar series of runs started, there is little doubt
that the same measures would have been taken as in 1907, a restriction of
payments. Restriction would have almost
certainly prevented the subsequent series of bank failures in 1931, 1932 and
1933, just as restrictions in 1907 quickly ended bank failures. (Friedman 80: 82). At the peak of the peak of business in mid
1929, nearly 25,000 commercial banks were in operation in the United
States. By early 1933 the number had
shrunk to 18,000. When the banking
holiday was ended by President Roosevelt ten days after it began, fewer than
12,000 banks were permitted to open, and only 3,000 additional banks were later
permitted to do so. All in al,
therefore, roughly 10,000 out of 25,000 banks disappeared during those four
years, through failure, merger or liquidation.
The total stock of money showed an equally drastic decline. For every $3 of deposits and currency in the
hands of the public in 1929, less than $2 remained in 1933, a monetary collapse
without precedent (Friedman 80: 84).
Although the stock market had been a national obsession in
1929, its crash had not directly affected that many families. To be sure 659 banks failed in 1929, but that
was slightly below the annual average for the decade and no major banks had
collapsed as a result of the crash (Gordon 04: 318). President Herbert Hoover called a conference
of businessmen in November 1929 and urged them to invest in construction, he
telegraphed state governors, who funded 80 percent of government construction,
to do the same and in the spring he promised to increase spending by $140
million. No small sum in a federal
budget that amounted to only $3.3 billion or about 3 percent of GNP. At the time twenty-five percent of the
federal budget went to debt service, and most of the rest to fund the 139,000
man army and the 95,000 man navy. The
winter and early spring of 1930 say the stock market rebound regaining about 45
percent of what had been lost. By the
Spring of 1930 it didn’t look as if more would be needed and President Hoover
told a religious group, “You have come sixty days too late. The depression is over.” (Gordon 04: 320). The
public put much of the blame for the Crash of 1929 on the banks, both for their
own stock speculation and because they pushed unsophisticated depositors into
buying overpriced stocks (Cohen 09: 276).
The Nation explained, “If you steal $25, you’re a thief. If you steal $250,000 you’re an
embezzler. If you steal $2,500,000
you’re a financier.”
Unfortunately Hoover then signed the Smoot-Hawley Tariff Act. This was economic folly. Tariffs are taxes and taxes inescapably are always a drag on the economy. But far worse, high tariffs breed retaliation from other countries. Professional economists knew this and a thousand of them signed a petition asking Hoover to veto the tariff bill. The economist’s arguments proved all too true and world trade began to collapse. Great Britain, the great champion of free trade since the 1840s, and the world’s largest trading nation, establish the “imperial preference system” to keep British trade within the British Empire. Other nations adopted similar restrictions. In 1929 total global trade had amounted to $36 billion. In 1932 it was about $12 billion. American exports had been $5.241 billion in 1929. Three years later they were a mere $1.161 billion, a 78 percent drop and below the export level of 1896 if inflation is factored in. As soon as the Smoot-Hawley tariff had been signed into law, the stock market began to give up its gains of the spring. By the fall, the banks were beginning to fail in growing numbers. The rate of failure had been up in 1930 over 1929, but not alarmingly so. But then in the last two months of the year 600 banks failed, making a yearly total of 1,352, more than twice the number of 1929. Most were the small unitary rural and poor urban neighborhood banks. The Bank of United States was another matter, it had deposits of $268 million, held by 450,000 depositors, closed its doors on December 11, 1930 (Gordon 04: 321).
Protective tariffs limit
industry. As a proportion of the gross
domestic product, exports were 6.2 percent in 1869-1873 and 5.8 percent in
1907-1911, the highest percentage reached in these years was 8.2 percent in the
agricultural boom years of 1877-1881 (Schlesinger 99: 134). The transformation
of America during the First World War from a debtor to a creditor nation made
protection more than ever the mortal enemy of foreign markets. Yet the business community and the Republican
Party, oblivious to the behavior demanded of them by the Open Door school,
responded by establishing the highest tariff rates up to that point in American
history in 1922 and still higher rates in 1930.
By 1932 exports fell to 2.8 percent of the gross national product
(Schlesinger 99: 135). In the half
century after 1920, omitting the years of the Second World War, exports
exceeded 6 percent of the gross national product in only two years (1921 and
1947) and went overwhelmingly, not to the underdeveloped world, but to other
developed countries. As late as 1970,
exports and imports together amounted to only 8.5 percent of the gross national
product. Not until the 1980s did foreign
trade assume real importance for the modern American economy, accounting for
nearly 20 percent of the gross national product. The merchandise trade deficit, the gap
between imports and exports, was the highest in American history (Schlesinger
99: 136).
At the end of 1930, the country, while certainly experiencing hard times, was only in an ordinary depression, not even one as severe as that experienced in 1920-1921. Then unemployment had averaged 11.9 percent. In 1930 unemployment did not reach 9 percent. It was in 1931 that the depression would become the Great Depression. In the early of months of 1920 it looked as if the bottom had been reached and prosperity was around the corner. Then events in Europe intervened. On May 11, 1931 credit Ansalt, Austria’s largest bank and one of the most influential in Europe, failed. This was a far greater collapse than the Bank of United States and a number of banks in Austria and Germany quickly followed it into oblivion. Germany’s economy, already under huge pressure from reparations, began to implode. Herbert Hoover proposed a one-year suspension of both loan repayments to the United States by the Allied Powers and German reparations to the Allied Powers, payments never resumed. On July 13, 1931 Danat Bank, Germany’s largest, suspended operations, the Berlin stock market and city banks were closed. The European financial system was in danger of collapse and the crisis soon spread to London. On September 21 Britain went off the gold standard, which Britain itself had first established in 1821. Britain’s days as a financial Great Power were over. The United States moved to bolster its gold standard. Bank depositors rushed to withdraw their money, and in the month after Britain abandoned the gold standard, 522 American banks failed (Gordon 04: 323-324).
By the end of 1931 the United States faced economic circumstances such as it had never faced before. Bank failures had totaled 2,293 that year, each a tragedy for hundreds or thousands of families who saw their savings vanish. Unemployment spread relentlessly through the American economy rising to 15.9 percent by the end of the 1931. GNP fell by a further 20 percent, automobile production which had been 4.5 million in 1929 fell to 1.9 million in 1931, causing massive lay offs. With tax receipts plummeting by $900 million and expenses rising $200 million the federal budget went into deficit by half a billion dollars in fiscal 1931, equal to 13 percent of revenues, the largest peacetime deficit since the depression of the 1893. At the time it was the conventional wisdom that balancing the budget was the first priority of the federal government after the defense of the Republic. The idea that government should spend in deficits in time of economic crisis had yet been coined. In late 1931 Hoover asked Congress for a huge tax increase to balance the budget, which they granted. Hoover also signed a bill on February 2, 1932 that capitalized at $500 million and authorized the issuance of up to $2 billion in bonds, the Reconstruction Finance Corporation to provide emergency loans to banks, life insurance companies, farm mortgage associations, and railroads that otherwise might have collapsed. Within six months the RFC had loaned out $1.2 billion, equal to a quarter of all federal expenditures that year (Gordon 04: 326).
The Federal
government that Hoover presided over was small and limited in scope to
conventional wisdom. Herbert Hoover said on 25
March 1932, “the absolute necessity of a balanced budget is the most essential
factor to economic recovery (5 May) the imperative and immediate step (13 May)
indispensable (21 May) the first necessity of the Nation (11 August) the
foundation of all public and private financial stability (11 August) (Cohen
09). The government
collected little revenue and therefore it had little money to dispense. The federal income tax had been in effect a
mere twenty years, and only about 5 percent of Americans paid it. The total federal budget was just $3.3 billion. Between 1930 and 1932 773 national banks and
3,604 state banks, with more than $2.7 billion in assets, had failed. As rumors of impending bank failures spread,
depositors rushed to withdraw their money.
The Bank failure started in Nashville, in the fall of 1930 and spread
through the South and the Midwest.
Hoover yielded to Congressional pressure in 1932 establishing the
Reconstruction Finance Corporation. The
RFC, which began with $3.5 billion in government funds and borrowing capacity,
was authorized to lend money to troubled banks, mortgage companies and other
financial institutions that were able to provide adequate security. The government deficit in 1932,
despite Hoover’s tax increase, was $2.7 billion. Revenues had been a mere $1.9 billion. It was the worst peacetime deficit in the
nation’s history. GNP was $58 billion, a
mere 56 percent of what it had been three years earlier. Unemployment stood at an entirely
unprecedented 23.6 percent. The number
of hours of labor worked in 1932 was fully 40 percent below the level of
1929. Another 1,453 banks had failed,
bringing the depression total to a staggering 5,096. In 1929 Americans had held about $11 in bank
deposits for every dollar in currency and coin in circulation. By 1932 the ratio was five to one, because so
many banks had failed and so many more were distrusted. The Dow Jones Industrial Average was down 90
percent from its high three years before (Gordon 04: 328).
The
Federal Reserve didn’t understand and in its Annual Report for 1933 lauded
itself, “The ability of the Federal Reserve Banks to meet enormous demands for
currency during the crisis demonstrated the effectiveness of the country’s
currency system under the Federal Reserve Act.”. In 1929, 1930 and 1931 the New York Federal
reserve Bank repeatedly urged the System to engage in large-scale open market
purchases, the key notion the System should have taken but did not (Friedman
80: 85). On symbol of the change was the
transfer of the Federal Reserve Board from modest offices in the U.S. Treasury
Building to a magnificent Greek temple of its own on Constitution Avenue, since
supplemented with a massive additional structure (Friedman 80: 89).
By 1932 the shock wave of the Crash of 1929 had
brought devastation to every corner of the country. One-fourth of the nation’s workforce was unemployed
and Fortune magazine estimated that 27 million Americans were without a regular
income. People with jobs struggled to
survive on wages that had plunged to near starvation levels. Up to 90 percent of children in some schools
were underweight and many were drowsy from malnutrition. The nation was crying out for the government
to respond, but President Herbert Hoover refused to acknowledge the seriousness
of the crisis. His free-market ideology
taught him that private enterprise should be the source of all solutions, and
his near-religious commitment to “rugged individualism” convinced him that
giving aid to the Depression’s victims would morally damage them. Hoover’s callousness earned him the enmity of
the unemployed and the bleak encampments erected in parks and under bridges
were dubbed “Hoovervilles” (Cohen 09). The hard times had thrown hundreds of thousands of
Americans off the land. Many rode the
rails or trekked from town to town in search of work. In 1932 Southern Pacific, a single railroad
ejected 682,457 people from its trains.
FERA issued grants, through a program called the Transient and Homeless
Relief, to provide direct aid to transients and to build camps around the
country where they could spend the night.
Urban homelessness was an even bigger program. A nationwide survey in early 1933 estimated
that there were 1.5 million Americans without homes. Many were living in Hoovervilles or sleeping
on streets or in open fields (Cohen 09: 272).
|
|
1929 |
1933 |
|
Food |
$19.5 |
$11.5 |
|
Housing |
$11.5 |
$ 7.5 |
|
Clothing |
$11.2 |
$ 5.4 |
|
Automobiles |
$ 2.6 |
$ 0.8 |
|
Medical care |
$ 2.9 |
$ 1.9 |
|
Philanthropy |
$ 1.2 |
$ 0.8 |
|
Value of shares on the NYSE |
$89.0 |
$19.0 |
Source: Historical Statistics of the United States, p. 319.
The national
ideology was laissez-faire economics and rugged individualism and the federal government
was small in scope and ambition until the New Deal. “The sole function of the government is to
bring about condition of affairs favorable to the beneficial development of
private enterprise”. Hoover had declared
in 1931. The 1932 presidential campaign
was not just a contest between two men, but one between two philosophies of
government. Roosevelt supported workers’
rights, safer workplaces and more generous worker compensation laws when
citizens are unable to find work, the state must help them, not as a matter of
charity, but as a matter of social duty.
As the governor of the nation’s most populous and wealthy state,
Roosevelt proceeded to establish major relief programs for the unemployed. In his acceptance speech on July 2, he made a
historic promise, “I pledge you, I pledge myself, to a new deal for the
American people” A favorite passage of
Roosevelt’s 1 Corinthians 13:13 “And now abideth faith, hope, charity, these
three; but the greatest of these is charity.”
With Roosevelt’s election public power had new life. Roosevelt had championed public power since
his days in the New York legislature. As
governor, he had established a public power authority, fought to construct
hydroelectric plants on the Saint Laurence River and battled to keep the rates
of private power companies in check.
When private power companies acted badly or raised their rates
excessively, communities should be able to punish them by turning to public
power instead. Roosevelt and his adviser introduced a new philosophy, one that
held that Americans had responsibilities to one another, and that the
government had a duty to intervene when capitalism failed (Cohen 09: 146-147).
Roosevelt’s
disability was caused by polio, which he had contracted in the summer of 1921,
a harsh moment of adversity in an otherwise privileged life. He was born in Hyde Park, New York, in 1882,
to James and Sara Delano Roosevelt, and had grown up in a sprawling estate on
the Hudson River. Roosevelt was not an
academic star, generally earning no better than “gentleman’s C’s”, but he was
well liked by his classmates, and distinguished himself by being elected
president of the school newspaper, the Harvard Crimson. After college, Roosevelt moved to New York to
attend Columbia Law School and married a distant cousin, Anna Eleanor
Roosevelt. The Hudson Valley Democrats
approached him in 1910 to run for the State Senate from a Republican
District. When he arrived at the
legislature, Roosevelt made political reform his chief cause. During World War I Roosevelt began an intense
relationship with Lucy Mercer, Eleanor’s beautiful social secretary. Roosevelt and Eleanor came close to divorcing
over the affair. In the end Roosevelt
broke it off with Lucy. In 1920, the
Democratic Presidential nominee, Ohio governor James M. Cox, asked the
thirty-eight year old Roosevelt to be his running mate. They lost to Warren G. Harding and Calvin
Coolidge in an election that marked the beginning of twelve years of Republican
rule. It was in this summer that Roosevelt
contracted polio, on a visit to his
family’s cottage on Campobello Island, Ne Brunswick. Roosevelt bought a 1,200 acre rehabilitation
center in rural Warm Springs, Georgia, where he worked to heal himself, and
helped other with polio (Cohen 09).
The election of 1932 was a
watershed in narrowly political terms.
In the seventy-two years from 1960 to 1932, Republicans held the
presidency for fifty-six years, Democrats for sixteen. In the forty-eight years from 1932 to 1980,
the tables were turned, Democrats held the presidency for thirty-two years,
Republicans for sixteen (Friedman 80: 91).
From the founding of the Republic to 1929, spending by governments at
all levels, federal, state, and local, never exceeded 12 percent of the
national income except in time of major war, and two-thirds of that was state
and local spending. Federal spending
typically amounted to 3 percent or less of the national income. Since 1933 government spending has never been
less than 20 percent of national income and is now over 40 percent, and
two-thirds of that is spending by the federal government. True, much of the period since the end of
World War II has been hot or cold war.
However, since 1946 nondefense spending alone has never been less than
16 percent of the national income and is now roughly one-third the national
income. Federal government spending
alone is more than one-quarter of the national income in total, and more than a
fifth for nondefense purposes alone. By
this measure the role of the federal government in the economy has multiplied
roughly tenfold in the past half-century (Friedman 80: 92). Most of this growth in big government can be attributed to the
policies enacted by FDR. In the election
of 1932 Franklin D. Roosevelt took all but six states, winning in a
landslide. Herbert Hoover had failed,
the people wanted change (Cohen 09: 329).
The banking panic of 1933 was initiated by a series of bank
failures. It was intensified by the
interregnum between Herbert Hoover and Franklin D. Roosevelt, who was elected
on November 8, 1932, but not inaugurated until March 4, 1933. Herbert Hoover was unwilling to take drastic
measures without the cooperation of the President elect, and FDR was unwilling
to assume any responsibility until he was inaugurated (Friedman 80: 83). Roosevelt took charge. He ordered a bank holiday in his first
fireside chat. In his first 100 days he
exercised dictatorial powers to pass legislation, the record is astonishing:
March 9 Roosevelt signs the Emergency Banking Relief Act
March 20 Roosevelt signs the Economy Act, reorganizing the government and cutting salaries and the pensions of veterans, perhaps the most powerful lobby at the time, to reduce expenses by $500 million.
March 21 Roosevelt signs the Civilian conservation Corps Reforestation Relief Act, to employ up to 250,000 young men in construction and environmental projects.
March 22 Roosevelt signs the Beer-Wine Revenue Act, legalizing beer and wine with less than 4 percent alcohol and taxing it heavily to increase government revenues
April 19 Roosevelt to the country off the gold standard, demonetized gold by making gold coins no longer legal tender and recalling them to the Treasury, and forbidding citizens to hold bullion. The next year he devalued the dollar from $20.66 to an ounce of gold to $35.00
May 12 Roosevelt sings the Federal Emergency Relief Act to provide grants totaling $500 million to states to fund relief for the unemployed.
May 12 Roosevelt signs the Agricultural Adjustment Act to relive farmers with measures to raise farm prices, limit production and refinance farm mortgages.
May 18 Roosevelt sings the bill authorizing the establishment of the Tennessee Valley Authority to develop the Tennessee River Valley by building dams that would provide electric power in seven states.
May 27 Roosevelt signs the Federal Securities Act, which required full disclosure of pertinent information to investors, the first federal regulation of the securities business.
June 5 Congress by joint resolution canceled clauses in contracts requiring payment in gold.
June 6 Roosevelt sings the Home Owners Refinancing Act establishing the Home Owners Loan Corporation, which was empowered to issue $2 billion in bonds to help nonfarm home owners keep their properties.
June 16 Roosevelt signs the Banking Act of 1933, usually known as the Glass-Steagall Act after its congressional sponsors. It revolutionized American banking.
June 16 Roosevelt sings the Farm Credit Act to help refinance farm mortgages.
June 16 Roosevelt sings the Emergency Railroad Transportation Act to increase federal regulation of railroads and rail road holding companies.
June 16 Roosevelt signs the National Industrial Recovery Act to create the National Recovery Administration (NRA) which established a series of industrial cartels to limit excessive competition (Gordon 04: 335)
Franklin Delano Roosevelt
promised a new approach. When Roosevelt
took office he chartered a new course that was determined during the first on
hundred days of his presidency. The
Hundred Days, as the press would later name the period, began with a remarkable
inaugural address. After assuring a
despairing nation that “the only thing we have to fear is fear itself”,
Roosevelt promised “action, and action now.”
Roosevelt shepherded fifteen major laws through Congress, prodded along
by two fireside chats and thirty press conferences. He created an alphabet soup of new agencies –
the AAA, the CCC, the FERA, the NRA – to administer the laws and bring relief
to farmers, industry, and the unemployed.
By definition a depression is a period of economic contraction,
and Roosevelt’s Hundred Days brought the contraction that had begun in early
1929 to a close. In 1933 the Dow rose
almost 60 percent. The GNP was a mere
$55.6 billion in 1933, its lowest since 1916.
The next year it was $65.1 billion.
By 1937 it was $90.5 billion. The
money supply and wholesale prices also increased at the rate of 10 to 12
percent annually in the four years following early 1933. Unemployment, however, stayed stubbornly
high, dropping only to 14.3 percent in 1937.
As the result of the high levels of unemployment the number of people
receiving high school diplomas almost doubled in the 1930s, while those
receiving college degrees increased by 50 percent (Cohen 09: 336). The amount of GNP that flowed annually
through the federal government began a steady rise. Government outlays in 1929 had been about 3
percent of GNP. In 1940 they were more
than 9 percent. The national debt, meanwhile,
had swelled from 16 percent of GNP to more than 50 percent, by far the greatest
peacetime increase up to that point (Gordon 04: 343). Since
the crash of October 1929, stock prices had plunged 85 percent. Manufacturing had all but ground to a
halt. The automobile industry was
operating at 20 percent of capacity, and the steel industry at just 12
percent. Between one-quarter and
one-third of the workforce was jobless.
People leapt at the mere possibility of a paycheck. An advertisement for 750 men to dig a canal
in Birmingham, Alabama, for twenty cents an hour drew 12,000 applicants. Farm income had plunged from $6.7 billion in
1929 to just $2.3 billion in 1932. Crop
prices were so low that farmers could not cover their expenses (Cohen 09).
Fig. 8.1 US Gross Domestic Product 1910-1960 (in billions of 2005 dollars)

Source: Wikipedia based on data in Louis D. Johnston and
Samuel H. Williamson, "What Was the U.S. GDP Then?" MeasuringWorth,
2008.
On inauguration
day, the nation’s banks were teetering on the brink of collapse. Thousands had already failed, and all
forty-eight states had declared bank holidays, preventing more banks from
failing by cutting depositors off from their money. Within days Roosevelt had declared a national
bank holiday and signed the Emergency Banking Act, which immediately put the
banking system on a firmer footing. He
then delivered a remarkable fireside chat that restored the public’s faith in
the banking system. When the banks
reopened, the public rushed to put money in, not take it out, and the crisis
was over. A second Banking Act of 1933
made deeper reforms. Roosevelt created
the nation’s first federal relief program, the Federal Emergency Relief
Administration, which supported the unemployed with federal money dispensed
according to federal standards. He
established two major public works programs.
The Civilian conservation corps sent 250,000 jobless young people out
into nature to plant trees and reclaim the land. The National Industrial Recovery Act allocated
$3.3 billion for a wider range of projects.
Roosevelt also created an agency, the national Recovery Administration,
charged with helping industry het back on its feet. In exchange of that help, he got companies to
agree to minimum wages and maximum hours, a legal right for unions to organize
and a ban on child labor. The Truth in Securities Act, regulated issues of
stock. America was taken off the gold
standard, allowing him to battle deflation.
In Roosevelt’s
first week in office, 450,000 letters arrived at the White House. His distinctive leadership style meant that
his inner circle had enormous influence and a rare chance to shape
history. $1 billion in Veteran’s benefits
administrated in 1932 constituted more than 25% of the federal budget, and the
government economy bloc in Congress argued that their benefits were excessive
(Cohen 09: 95). On Wednesday, March 25
1932 the Economy Act passed on a 62-13 vote.
All presumptive cases of veteran disabilities were removed from the list
and benefits for veterans whose injuries occurred during war time were
substantially reduced (Cohen 09: 107).
The cuts, which had been projected to total $383 million, had reached
$460 million. There were reports that
even soldiers who had been wounded in combat had seen their pensions reduced by
60 percent or more, from $94 a month to $36 a month. Roosevelt issued executive orders restoring
$50 million in benefits, but Progressives in Congress reached a compromise, to
restore $77 million more. The
administration agreed to keep making payments to 154,000 veterans with
“presumptive” disabilities (Cohen 09: 280).
The members of FDRs brain trust were drawn mainly from the
universities, in particular, Columbia University (Friedman 80: 92). The New Deal, as it emerged during the 1930s,
included programs designed to reform the basic structure of the economy. Some of these had to be abandoned when they
were declared unconstitutional by the Supreme Court, notably the NRA (National
Recovery Administration) and the AAA (Agricultural Adjustment
Administration). Others are still with
us, notably the Securities and Exchange Commission, the National Labor
Relations Board and nationwide minimum wage laws. The New Deal also included programs to
provide for security against misfortune, notably Social Security (OASI, Old Age
and Survivors Insurance), unemployment insurance and public assistance
(Friedman 80: 93). Five of Roosevelt’s advisers – Raymond Moley,
Lewis Douglas, Henry Wallace, Frances Perkins and Harry Hopkins – had the
greatest influence on the Hundred Days.
Only Perkins and Wallace were Cabinet members. After heading the Brain Trust and serving as
chief speechwriter on the campaign, Moley accepted an offer to join the
administration as a top aide to the President.
Lewis Douglas, the director of the budget, was the other member of the
“bedside Cabinet”. Henry Wallace, the
secretary of agriculture, was a brilliant farmer scientist from Iowa, the third
Wallace generation to edit Wallaces’ Farmer, his family’s farm journal. Frances Perkins , the secretary of labor, was
the first woman Cabinet member, was born into a conservative New England
family, but she broke away after college to work with Jane Addams at Hull
House, ministering to Chicago’s immigrant.
After moving to New York she became an advocate for workers. She had served as Roosevelt’s state
industrial commissioner, and as a result had worked with him longer than almost
anyone else in the administration. Harry Hopkins was the last to joint the administration, arriving on day
79. After graduating from college in his
native Iowa, Hopkins moved to New York’s Lower East Side, where he worked in a
settlement house. He became a prominent
social worker, and after the Depression hit, headed the emergency relief agency
Roosevelt created in New York. Hopkins
persuaded Roosevelt to create a $500 million federal relief program.
Although it got
off to a slow start, the AAA had a dramatic impact on the prices of wheat,
cotton, corn and hogs, and on the income of the farmers who produced. From 1932 to 1936 farm income increased 50
percent. The ratio of farm to city
income which had fallen to 48 percent in 1932 would rise to 79 percent. The AAA did not instantly end the farm
crisis, but it brought a badly needed infusion of money into the Farm Belt,
made it possible once again to farm profitably and defused the radicalism that
had been sweeping the region. In January
1936 the Supreme Court ruled that the AAA was unconstitutional, holding that
the processor tax was an abuse of the government taxing authority (Cohen 09:
300). The problem with the New Deal farm programs was that once in place they
proved impossible to dismantle. Although
the agricultural emergency ended when the Depression did, the farm programs
never went away. They continued to
dispense subsidies as family farms gave way to agribusinesses, and an
ever-shrinking percentage of Americans made their living through farming. At the start of the twenty-first century,
more than 70 percent of the subsidies were going to large farms. According to one government study, as much as
30 percent of the $26 billion in agricultural subsidies the government handed
out in a single year went to people ineligible to receive them. With the rise in globalism it became clear
that the farm programs were harming third-world farmers, who were unable to
compete with highly subsidized American crops (Cohen 09: 301).
Simon Nelson
Patten, a renowned economist teaching at the University of Pennsylvania was an
early exponent of the idea that economies are driven by consumption and that
spending was what kept the economy strong.
One article he wrote had the title “Extravagance as a Virtue” where
Patten advocated social welfare programs for those in need. He was also an early supporter of the
emerging field of social work, which he regarded as “a new kind of charity...
to undermine energy and productive ability or to create a parasitic class, but
to distribute the surplus in ways that will promote general welfare.” (Cohen
09: 167). In early 1929, Perkins took
charge of the nation’s largest state labor department, with 1,800
employees. Not long after taking office,
she was honored at a luncheon at the Hotel Astor, attended by nearly 1,000
people. The event was not to celebrate
her as a person, she told the gathering, but the idea “that social justice is
possible in a great industrial community”.
Perkin’s vision was the complete opposite of the business-oriented,
laissez-faire policies coming out of the Hoover administration. In addition to safer working conditions,
minimum wage and maximum hour laws, and the abolition of child labor, she said
she would fight to affirm the dignity of work.
181 At the center of the “awful strange mess” in the Department of Labor
was Section 24, the special immigration unit.
It took its name from Section 24 of the Immigration Act of 1917 that
made it illegal to form employers to bring in foreign workers to do contract
labor. Section 24 agents routinely
overstepped their legal authority. In
one notorious case, they raided homes in Detroit and imprisoned more than six
hundred immigrants on charges of being in the country illegally. Only two of the immigrants turned out to be
legitimately subject to deportation.
When they raided homes, workplaces and social halls, they regularly
shook down the immigrants they found for bribes, threatening them with
deportation if they did not pay up.
Perkins terminated funding for the program (Cohen 09: 159).
The Civilian
Conservation Corp would help rescue the nation’s forests and national
parks. Unrestricted timber harvesting
had reduced the virgin forest from 800,000 acres to just 100,000, and the
plight of forests and parks was being made worse by severe soil erosion. Water and wind were removing six billion tons
of soil a year. The CCC was public works
on the cheap. Young, unmarried men,
would be willing to work for low wages, $1 a day, especially when their room
and board were being provided (Cohen 09: 209).
By mid-July, 275,000 workers would be employed at more than 1,300
camps. Most of the participants earned
$30 a month and sent home $25, supporting an estimated one million family
members (Cohen 09: 225). The $5 billion
appropriation for public works was pared down to $3.3 billion. On May 7 Roosevelt delivered his second
fireside chat, to lay out the administration’s broader vision for
recovery. He went through the bills that
had already been passed, or soon would be, the laws creating the CCC and the
Tennessee Valley Authority, famers and home-owners mortgage relief and the
federal emergency relief bill, both of which would soon become law. There were all part of a “well grounded plan”
(Cohen 09: 236-237). The Depression
challenged the nation’s beliefs about the poor.
After the economic crisis threw millions of Americans out of work, it
was clear that poverty could be caused by brutal economic circumstances, not
just weak character (Cohen 09: 248). The
economic crisis had broken down the traditional methods of caring the
poor. Between 1929 and 1932 about one
third of the private agencies that cared for the poor closed down for lack of
money. Many of the remaining teetered on
the brink of insolvency (Cohen 09: 249).
On Sunday, May
21, 1933 after accepting the position of federal relief administrator, Hopkins
took the train to Washington. On Day 79
of the Hundred Days, Hopkins went to work.
Since 1929 national income had fallen by more than 50 percent. On May 1, the Commerce Department had
reported that unemployment had reached an all time peak. As many as 16 million people were jobless,
representing about one quarter of the workforce and each unemployed worker had
an average of three dependents relying on him for support (Cohen 09:
265-266). Under the Federal Emergency
Relief Act (FERA) Hopkins started handing out money right away. In his first two hours, Hopkins dispensed
more than $5 million to eight states that had run out of money and were on the
brink of shutting down their relief programs.
Hopkins quickly became a national ambassador, vehemently defending
relief programs and their recipients (Cohen 09: 267). Hopkins wasted little money on the FERA
headquarters, preferring to put funds directly into the hands of the
unemployed. In its first year FERA
supported 17 million people with a staff of just 121, who earned a combined
income of $22,000. Despite the low pay
scale FERA attracted a first rate staff.
Hopkins was eager to establish national standards for benefit levels. The tradition of local responsibility for
welfare programs meant that levels of support varied greatly across the
country. The average monthly grant for a
family in New York was $33.22. In
Mississippi it was $3.86. Hopkins
declared, “We are not going to allow relief agencies to starve people to death
with our money” (Cohen 09: 270).
FERA considerably
improved conditions in homeless shelters, which had long been among the
grimmest parts of the relief network. To
receive federal funds, shelters had to meet standards for beds, food, health
care, recreation, bathing facilities and laundry (Cohen 09: 272). Although he insisted that cash benefits were
often necessary, Hopkins believed they were a poor substitute for work. Hopkins was committed to finding ways to
provide the unemployed with the dignity of earning their own living. By fall, Hopkins had won Roosevelt’s approval
for the Civil Works Administration, which put onetime relief recipients to work
on a wide array of government projects.
When 2 million jobs were made available 9 million applied. CWA funds were used to hire architects and
draftsmen to work on the Historic American Buildings Survey. He put painters, musicians and writers to
work on artistic and literary projects, forerunners of the public art programs
the Works Progress Administration (WPA) would later sponsor (Cohen 09:
273). Between May 1933 and the end of
1935, Hopkins would hand out more than $3 billion in grants. At the FERAs peak, in January 1935, more than
20 million people, fully 16 percent of the population were being helped by it
(Cohen 09: 276).
The most
controversial reform being proposed was federal deposit insurance. Steagall, who had supported federal deposit
insurance for 15 years, included it in his House bill. But the American Bankers Association and many
large Eastern banks argued that it would unfairly require healthy banks to bail
out struggling ones, and in the process would put a strain on the entire system
(Cohen 09: 277). The Glass-Steagall
bill, formally called the banking Act of 1933, was opposed in its federal
depositors insurance provision by Roosevelt.
Vice President Garner, supported it.
Support in Congress was however overwhelming and there were enough votes
for an override. Economists Milton Friedman and Anna Schwartz called federal
deposit insurance “the structural change most conducive to monetary stability
since state bank notes were taxed out of existence immediately after the Civil
War (Cohen 09: 278). The explosion of
new legislation during the Hundred Days transformed vast swaths of American
life, from banking to agriculture to public welfare. The Hundred Days greatest impact, though, was
one of national philosophy. In just over
three months, the federal government changed from being a nearly passive
observer of its citizens’ problems to an active force in solving them. From this point on, it would be a matter of
concern to Washington when farmers were unable to support themselves, when
depositors lost their lie savings in failed banks and when parents could not
afford to feed their children. The
relationship between the American people and their government would never be
the same again (Cohen 09: 284).
The Supreme Court would invalidate much of what came to be
called the First New Deal, notably the NRA.
In 1935, Roosevelt embarked
on the so-called “Second New Deal” more liberal and more critical of big
business than the first. This was the
era that ushered in the Works Progress Administration, the National Labor
Relations Act, and Social Security. The
voters continued to support the New Deal in its new incarnation. In 1936 Roosevelt would win reelection
against Alfred Landon, an anti-New Deal Republican who attacked Social Security
as a cruel hoax, taking 61 percent of the vote.
Roosevelt declared that he saw “one third of a nation ill-housed,
ill-clad and ill-nourished and the test of our progress is not whether we add
more to the abundance of those who have much, it is whether we provide enough
for those who have too little.” In 1937
Roosevelt decided to slash spending cutting many New Deal programs such as the
CCC (Cohen 09: 289). As historian Alan
Brikley has written, “In the Roosevelt recession of 1937 and early 1938, the
Dow Jones Industrial Average fell 48 percent in seven months. Roosevelt eventually reversed the cuts and
resumed deficit spending (Cohen 09: 289).
At the end of the special session, sixty-six nations gathered in London
for the World Economic Conference.
Conservative had high hopes that if the gathering could reach an
agreement to stabilize world currencies, and if nations like England and
Germany could be persuaded to restore the gold standard, the conference could
bring the global depression to an end (Cohen 09: 289).
Roosevelt responded in 1935 with an initiative called the Second New Deal, this called for Social Security, further banking reform, more extensive works programs, including the WPA, higher taxes on high incomes and inheritances and strong protection for organized labor to make it easier for union to organize workers. In 1935 the National Labor Relations Act, usually known as the Wagner Act, was passed. It guaranteed the right of workers to join a union of their choice and to bargain collectively with their employers. Further, it included a long list of unfair labor practices” that companies were forbidden to engage in. It established the National Labor relations Board to police the labor marketplace and supervise elections. Most major industrial states soon passed laws modeled on the Wagner Act (Gordon 04: 344). In the six years following passage of the act, union membership more than doubled. By the early 1950s unions would represent about 35 percent of the American workforce (Gordon 04: 345). Another crucial part of the Second New Deal was the move to bring electricity to vast areas of the country that did not have it. Because private enterprise could not bring electricity to much of the countryside, Roosevelt established the Rural electrification Administration to do so. It worked to form publicly owned, nonprofit, electrical cooperatives to provide power to areas that did not have it. When the REA was formed in 1935, only two farms in ten in the United States had electricity, just a little more than a decade later, eight in ten did (Gordon 04: 345). Union membership increased from 2,689,000, o4 6.9 percent of workforce in 1933, to 8,763,000 or 19.2 percent of the workforce in 1939 (Cohen 09: 304). In 1934 Perkins began drafting an unemployment insurance bill while public support was building for old age insurance. Roosevelt appointed Perkins to chair the Committee on Economic Security. 304 The committees final recommendations went far beyond unemployment and old-age insurance. Along with those insurance programs, which would be paid for by employer and employee contributions, it called for relief programs to cover categories of needy individuals who could not pay premiums: dependent children, the disabled, and the unemployed elderly. The committee nearly included national health insurance, but it backed down. Its inclusion would have aroused such vehement opposition, by the American Medical Association. Roosevelt signed the Social Security Act on August 14, 1935 (Cohen 09: 304).
Although it took World War II to restore the unemployment rate to where it had been before the Great Crash, the New Deal did produce steady economic improvement. The nation’s total production increased significantly between 1934 and 1936. By 1937, the gross national product reached 1929 levels. Unemployment had fallen to 14 percent in 1937, still high, but far below the rate of March 1933. Just as important, for people who remained unemployed, New Deal programs were providing a safety net. Most of the 20 million Americans who received relief from the FERA at its height, and the millions took CCC, CWA, or WPA jobs, would have been destitute if the nation had stuck by its Hoover Era principles (Cohen 09: 288). In 1937 the Federal Reserve using its newly granted power began to increase bank reserve requirements sharply for various technical reasons. At the same time, the Roosevelt administration began to cut public works spending to help bring the budget closer into balance. The result was a new depression. Unemployment soared back up to 19 percent the following year, while GNP dropped 6.3 percent. While technically the economy had been in recovery for four years the word depression is applied to the whole decade of the 1930s. Recovery began again in 1938, but unemployment remained stubbornly high, being at 14.6 percent as late as 1940 (Gordon 04: 346).
Fig. 8.2 US Unemployment 1910-1960
Source: Wikipedia data from 1910-1930 from Christina Romer (1986), "Spurious Volatility in Historical Unemployment Data", The Journal of Political Economy, 94(1): 1-37. Data for 1930-1940 from Robert M. Coen (1973). "Labor Force and Unemployment in the 1920's and 1930's: A Re-Examination Based on Postwar Experience", The Review of Economics and Statistics, 55(1): 46-55. Data for 1940-1960 from the US Bureau of Labor Statistics, Employment status of the civilian non-institutional population
In the end it was not the New Deal that cured what ailed the American economy, it was war (Gordon 04: 346). When the Civil Works Administration (CWA) began 814,511 workers were on the payroll. The 200,000 projects CWA workers undertook ranged from tearing down dilapidated houses in/Alabama to extending a municipal sewer system in Texas. The CWA was short lived, but it was the biggest public works program that had existed in America. It turned the New Deal’s focus even more toward providing the unemployed with jobs and salaries. In it lifetime the WPA employed 8.5 million people and supported 20 million, more than 20 percent of the population. In June 1939 federal public works programs still supported almost 19 million people, nearly 15 percent of the population. In addition to helping millions of American families survive the Depression, the WPA left a rich legacy of socially useful projects. Its workers constructed or repaired more than 125,000 buildings, including 83,000 schools, 800 airports, 950 sewage plants, and 650,000 miles of roads. They built or improved 78,000 bridges and 25,000 playgrounds, terraced 271,000 acres of eroded land and taught two million people to read. They also ran a famous Federal Art Project, which hired destitute artists to create murals for public buildings, posters and paintings (Cohen 09: 313).
In response to the outbreak of hostilities by Nazi Germany in 1939 Congress passed the Neutrality Act on November 4, 1939 which allowed purchases of war material to allies only on a cash and carry basis. Roosevelt knew Germany was no immediate threat to the United States and thought the British could hold the Nazis off long enough for the Americans to rearm. In 1940 Roosevelt asked Congress for a supplemental defense appropriation of $1.3 billion and the production of at least 50,000 planes a year. On September 16, 1940 Congress approved the first peacetime draft in American history and 16.4 million men between the age of twenty and thirty-five registered. The act called for the training of 1.2 million soldiers and 800,000 reserves in the next year (Gordon 04:351). Isolation vanished from the American political landscape on the morning of Sunday, December 7, 1941 when Japanese carrier aircraft attacked and gravely damaged the U.S. Pacific Fleet at Pearl harbor. The next day Congress declared war on Japan, and on Thursday December 11, Germany and Italy declared war on the United States (Gordon 04: 353).
In the first six months of 1942 the U.S. government gave out more than $100 billion in military contracts, more than the entire GNP of 1940. In the war years, American industry turned out 6.500 naval vessels, 296,400 airplanes, 86,330 tanks, 64,546 landing craft, 3.5 million jeeps, trucks and personnel carriers, 53 million deadweight tons of cargo vessels, 12 million rifles, carbines, and machine guns and 47 million tons of artillery shells, together with million of tons of uniforms, boos, medical supplies, tents and a thousand other items needed to fight a modern war. 354 With the American economy finally booming again unemployment fell below 10 percent in 1941 for the first time since 1931 and continued to fall rapidly all year. 353 In 1940 the GNP was $99.7 billion. In 1945 it was $211.9 billion. Even taking into account the 25 percent wartime inflation GNP increased 56.3 percent. 357 Unemployment became virtually nonexistent. With 20 percent of the male population in uniform, millions of industrial jobs were filled by women, by the end of the war they constituted fully one-third of the America labor force. As with all of the country’s major wars, government revenues and outlays rose both sharply and permanently. The government had never spent more than $18.5 billion in a single year (1919) before the Second World War, since the war it has never spent less than $33 billion and for all but five years in the late 1940s and early 1950s never less than $60 billion. The national debt soared along with expenses. It had stood at $43 billion just before the war. By 1946 it was at $269.4 billion, equal to 130 percent of GNP, by far the highest it has ever been before or since. Bond drives were instituted but only a quarter were held by individuals, the rest were held by banks, insurance companies and other financial institutions. Commercial banks had held less than a billion Treasury securities in 1941, by 1945 they held some $24 billion (Gordon 04: 358).
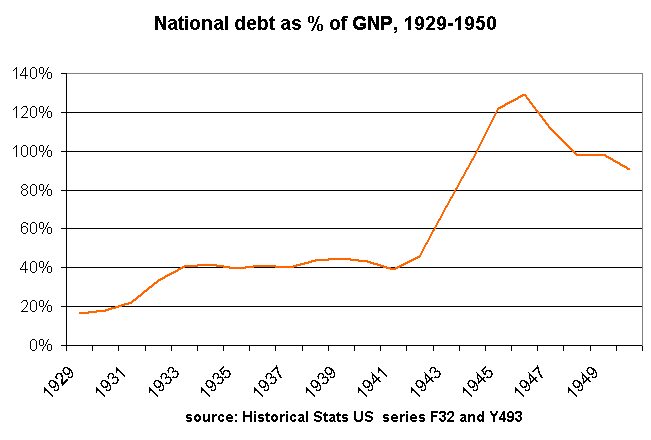
The United States was able to pay for about 45 percent of the war through taxation, far more than in the First World War or the Civil War. The revenue Act of 1942 transformed the federal tax system. Before 1942 the income tax largely affected the middle class and the rich. In that year only about four million Americans paid any income tax at all. By the following year, after the personal exemption had been lowered from $1,231 to $624, seventeen million owed income taxes. By the end of the war, as more and more Americans took wage-paying jobs, 42.6 million Americans were paying income taxes. Meanwhile rates on high incomes were raised sharply to as much as 94 percent. For the first time personal income tax yielded more revenue than the corporate income tax, twice as much by the end of the war. Despite greatly increased federal taxes and strict wage and price controls the citizenry was prospering and putting their money into savings. In 1940 personal savings had amounted to $4.2 billion, the same as in 1929, over the next five years, personal savings totaled an astonishing $137.5 billion (Gordon 04: 359). Washington had paid about half the expense of World War II by borrowing, and in 1945 the federal government owed $270 billion, the equivalent of 121 percent of the GDP. In 1945 it was the highest in U.S. history. The Truman administration ran a surplus during four of its eight years in office and managed to keep its four deficits small. When Truman left office, the federal debt was still $270 billion, but because the economy had grown and prices had risen that figure represented 71 percent of GDP (Wells 03: 41-42). After World War II the level of military spending declined sharply, hitting $13 billion in 1949, or less than 5 percent of GDP. This trend reversed sharply after 1950 as the war in Korea and the intensification of the Cold War dictated a huge military buildup. By 1953 defense spending had increased to more than $52 billion, or 14 percent of GDP. Peace in Korea after 1953 allowed modest reductions, but military spending remained close to 10 percent of GDP for the rest of the decade (Wells 03: 45).
World War II interrupted the New Deal, while at the same
time strengthening greatly its foundations.
The elimination of unemployment, demonstrated the capacity of the
government to run the economic system more effectively than unplanned
capitalism. One of the first pieces of
major legislation enacted after the war was the Employment Act of 1946, which
expressed government’s responsibility for maintaining “maximum employment,
production and purchasing power” and enact Keynesian policies into law. The war’s effect on public attitudes was the
mirror image of the Depression. The
depression convinced the public that capitalism was defective, the war was
efficient. Both conclusions were
false. The depression was produced by a
failure of government, not of private enterprise. As to the war, it is one thing or government
exercise great control temporarily for a single overriding purposes shared by
almost all citizens and for which almost all citizens are willing to make heavy
sacrifices, it is a very different thing for government to control the economy
permanently to promote a vaguely define “public interest” shaped by the
enormously varied and diverse objective of its citizens (Friedman 80: 95). When Roosevelt decided to run for an
unprecedented third term in 1940, Wallace became his running mate, replacing
Vice President Garner, who had challenged Roosevelt for the Democratic
nomination. Many conservative Democrats
opposed the choice, but Roosevelt had great respect for Wallace, who he thought
would make a good vice president and a worthy successor. In 1944 the Democratic National Convention
dumped Wallace from the ticket and nominated the more moderate Senator Harry
Truman of Missouri for vice-president (Cohen 09: 302).
On June 22, 1944 President Roosevelt signed the GI Bill of rights, formally the Serviceman’s Readjustment Act. It was intended to reward veterans for their bravery and to slow down the return of veterans to the job market. The GI Bill of Rights provided generous assistance to all honorably discharged veterans in paying education and housing while in school and assistance in buying houses and businesses after school was completed. 363 No fewer than eight million veterans obtained more education in college and technical schools that they otherwise would have. In 1950 some 496,000 college degrees were awarded, twice the number of a decade earlier. Between 1945 and 1952 the federal government spent $14 billion on GI education benefits. The GI Bill of Rights provided for Veterans Administration mortgages by which the Veterans Administration guaranteed, at first, half the mortgage up to $2,000, this was soon amended to allow guarantees of up to $25,000 or 50 percent of the loan, whichever was less. This helped millions of families acquire not only better housing that their parents had ever dreamed of, but something else, capital (Gordon 04: 365).
In 1945, at the close of World War II, Americans still lived in the shadow of the Great Depression. Many Americans expected the depression to resume once the war was over. But after 1945 the United States launched on an extraordinary boom that would last, with some fits and starts, until the 1970s. After a victorious war the United States enjoyed the world’s strongest economy, accounting for as much as 40 percent of the global production of goods and services. In 1939 production was still no higher than it had been in 1929 and unemployment was well over 15 percent. Chiefly because of huge defense orders the economy grew 75 percent between 1940 and 1944 and unemployment disappeared. But could prosperity survive peace? In 1944 the military purchased about 35 percent of the country’s output or Gross Domestic Product (GDP) (Wells 03: 6). By 1946 total employment was greater than its wartime peak, and unemployment was low, 3.9%. GDP did decline in the wake of demobilization, falling 14 percent between 1945 and 1947, but this reflected extraordinary wartime conditions rather than weakness in the postwar economy (Wells 03:16). The biggest problem with the post-war economy turned out to be not unemployment but inflation. Although GNP dipped slightly in 1946, as military orders fell from an annual rate of $100 billion in early 1945 to $35 billion a year later, GNP had recovered by year’s end and grew strongly thereafter. It required time for the country’s industry to shift back from war production to consumer goods the result was roaring inflation. In 1945 there were twelve million people in the armed forces and by 1946 that number had gone down to fewer than 2 million. Farm prices rose 12 percent in a single month and were 30 percent higher by the end of 1946. Automobile production, virtually nonexistent since 1942 reached 2,148,600 in 1946, but wouldn’t top 1929s production until 1949.
Corporate profits rose by 20 percent and labor unions demanded large increases in hourly wages and benefits. Soon after victory over Japan Truman suggested that wages might rise, provided that employers did not pass on increases to consumers in the form of higher prices. Labor unions seized this opportunity, demanding wage hikes of as much as 30 percent. Employers balked. Unions struck and by early 1946, 200,000 auto workers, 300,000 meat packer, 180,000 electrical workers and 750,000 steel workers were idle. In January 1946 fully 3 percent of the labor force, were on strike (Gordon 04: 371). In 1946 there were a total of 146 million man days lost to strikes. In each of the next three years there was an average of only 40 million. By 1992 fewer than 4 million man days were lost to strikes. The percentage of the workforce that was unionized peaked in 1945 at 35.6 percent and has been dwindling ever since. By 1960 it was only 27.4 percent and today stands at only 14 percent and would be lower if not for the spread of unionization among government, which began only in the 1960s (Gordon 04: 373). By early 1946 controls were unraveling. To shore them up, Truman asked Congress to extend his authority to impose controls for another year, to July 1947. In the later spring of 1946 the legislature did extend private controls, but he bill granted exemptions of concessions to a great many industries. The president considered the bill useless and vetoed it. The president lifted the remaining controls during the winter of 1946-47. Striking unions settled for wage increases that averaged about 18 percent, which employers generally passed on to consumers in the form of higher prices. Between 1945 and 1948 prices increased by a third, but stabilized in 1948 (Wells 03: 17).
General George C. Marshall, Army Chief of staff during the war, now the secretary of state, proposed what he called the Marshall Plan. In the next several years the Marshall Plan provided Europe with $13 billion and helped especially to get the economies of West Germany, France and Italy back on their feet. However the Marshall Plan aid was but a small fraction of American foreign aid in those years. Between 1946 and the early 1970s, when foreign aid programs began to wind down, the United States spent about $150 billion on economic aid to foreign countries. About one-third of this went to Europe, the rest in Asia, Latin America and elsewhere. With half the world’s GNP, the United States was running large export surpluses. With the help of such international organizations as the World Bank, the International Monetary Fun and the General Agreement on Tariffs and Trade (GATT now the World Trade Organization) the United states worked to establish a new world trading system and to lower tariffs on a worldwide basis to increase world trade. The result was a spectacular success. In 2000 total world trade was 125 times the level of 1950, equaling an astounding $7.5 trillion, including both manufactures and services (Gordon 04: 378).
In 1949 the countries of Western Europe created a payments union and devaluated their currencies by 20 to 30 percent against the dollar, making European exports cheaper and imports more expensive. The creation of the European Coal and Steel Community (ECSC) in 1950 further advanced the process of reform and opened new political possibilities for the continent. The ECSC proved a great success, allowing higher production at lower cost. In 1957 its members expanded on this example, signing a broad pact abolishing all barriers to trade between themselves, thereby creating the European Community, the forerunner of the European Union (EU). By this time Western Europe had fully recovered from the war and had begun a sustained boom at least as impressive that under way in the United States. Conditions were even worse in Japan than Europe and after the war the American military occupied Japan, governing it until 1952 when control returned to an elected Japanese government (Wells 03: 25-26). But by the late 1950s Japan had embarked on an extraordinary boom, with production more than quadrupling between 1958 and 1973 (Wells 03: 26). Laws in continental Europe made it difficult to discharge workers or eliminate an established union. But by making it difficult to dismiss workers, such laws made companies extremely cautious about hiring, limiting employment. Unemployment in most of Western Europe failed to decline much below 10 percent during the 1980s and 1990s (Wells 03: 134).
The American economy, by far the largest on earth before the war, now produced fully 50 percent of the world GDP. Eighty percent of the world’s monetary gold belonged to the United States, most of the rest was stored in the vaults beneath the New York Federal Reserve bank. Under the Bretton Woods Agreement of 1944, the dollar, convertible into gold by central banks, would be the world’s primary reserve currency, and the basis of world trade in the future (Gordon 04: 362). In 1947 a conference involving most of the leading trading nations agreed on the General Agreement on Tariffs and Trade (GATT), which cut tariffs by almost half. Subsequent GATT “rounds” in the 1960s and 1970s reduced tariffs on most goods to negligible levels. Throughout the post war period members regularly increased the capital of the IMF and the World Bank in line with the growth of the world economy. It took nearly fifteen years, but under GATT and Bretton Woods the industrial countries largely realized the ideal of an open world economy. Stable, convertible currencies and large reductions in trade barriers yielded the results Washington desired. Throughout the second half of the twentieth century, international trade expanded faster than total world production of goods and services, providing a great stimulus to growth (Wells 03: 27).
The pharmaceutical industry, which is closely related to chemicals, offered the most dramatic social gains. In the 1930s scientists had discovered penicillin, the first modern antibiotic, and it became available to Allied soldiers during the war. After 1945 drug companies offered it to the public at large, providing the first really effective treatment for a whole host of dangerous illnesses, from strep throat to pneumonia. In the 1940s and 50s companies also developed and marketed vaccines that largely banished a variety of grave diseases, including whooping cough, diphtheria, and polio. While pharmaceutical companies profited greatly, consumers benefited even more. Throughout the 1950s and 60s research and development consumed about 2.6 percent of the GDP. Companies provided a little less than half this sum, the government, primarily in defense and space programs, provided the other half (Wells 03: 32).
John Maynard Keynes first rose to fame when he attended the
Versailles Peace conference in 1919 with the delegation from the British treasury
and outraged with the peace treaty that emerged, wrote a book called the
Economic Consequences of the Peace. In
1936 he published his masterpiece, the General Theory of Employment, Interest
and Money, to explain the origins of the Great Depression and why it
persisted. Before Keynes, economists
had been mostly interested in microeconomics, Keynes was interested in
macroeconomics, how aggregate supply and demand affect national economies. Keynes argued that supply and demand must be
equal in the long run. In the short run
if there is too much supply, depression breaks out and if there is too much
demand, inflation occurs (Gordon 04: 379).
President Eisenhower said,
“When it comes to the advancing and expanding of our economy, that is by and
large the business of Americans; the federal government can help, but our
federal money will never be spend so intelligently and in so useful a fashion
for the economy as will be expenditures that would be made by the private
citizen, the taxpayer, if he hadn’t so much of it funneled off into the federal
government”. The ultimate conclusion of
this argument, is that “the least government is the best government” (Bernstein
62: 28)
In the 1930s to early 1940s, new births in the United States averaged around 2.3 to 2.8 million each year. In 1945, the number was 2.8 million births; it marked the beginning of the Baby Boom. In 1946, the first year of the Baby Boom, new births in the U.S. skyrocketed to 3.47 million births. New births continued to grow throughout the 1940s and 1950s, leading to a peak in the late 1950s with 4.3 million births in 1957 and 1961. (There was a dip to 4.2 million births in 1958) By the mid-sixties, the birth rate began to slowly fall. In 1964 (the final year of the Baby Boom), 4 million babies were born in the U.S. and in 1965, there was a significant drop to 3.76 million births. From 1965 on, there was a plunge in the number of births to a low of 3.14 million births in 1973, lower than any year’s births since 1945. Preceding the Baby Boom was the cohort called the Silent Generation (including those born from 1925-1945). Following the Baby Boom was Generation X (1964-1979) (Rosenberg 09). Between 1945 and 1965 American women had approximately eighty million babies (Wells 03: 29).
Fig. 10.1 U.S. Population
Growth 1790-2000
|
|
1790 |
1800 |
1810 |
1820 |
1830 |
1840 |
1850 |
1860 |
1870 |
1880 |
1890 |
|
Population |
3,929,214 |
5,236,631 |
7,239,881 |
9.638,453 |
12,866,020 |
17,069,453 |
23,191,876 |
31,443,321 |
38,558,371 |
49,371,340 |
62,979,766 |
|
Decade
Growth |
|
33.3% |
38.8% |
33.1% |
33.5% |
32.7% |
35.9% |
35.6% |
22.6% |
28.0% |
27.6% |
|
|
1900 |
1910 |
1920 |
1930 |
1940 |
1950 |
1960 |
1970 |
1980 |
1990 |
2000 |
|
Population |
76,212,168 |
92,228,496 |
106,021,537 |
123,202,624 |
132,164,569 |
151,325,798 |
179,323,175 |
203,211,926 |
226,545,805 |
248,421,906 |
281,421,906 |
|
Decade
Growth |
21.0% |
21.0% |
15.0% |
16.2% |
7.3% |
14.5% |
18.5% |
13.3% |
11.5% |
13.2% |
13.2% |
Source: Decennial Census
In the second half of the twentieth century the American economy experience extraordinary change. Between 1945 and 1973 US GDP grew 140 percent and real (inflation adjusted) per capita doubled. Living standards improved to the point where the large majority of Americans could reasonably describe themselves as middle class (Wells 03: 27-28). In the 1960s the United States enjoyed greater prosperity than in any other decade of its history. Between 1960 and 1970 GDP increased 50 percent as income surged and unemployment fell (Wells 03: 53). In the best prewar year, 1929, the United States had produced 4.5 million automobiles, in 1955 its factories turned out 7.9 million (Wells 03: 29). Between 1940 and 1950 the number of Americans with college degrees increased by 50 percent, from six to nine million. In the twenty years between the end of the Second World War and the mid-1960s the American economy almost doubled in real terms GNP grew from $313 billion to $618 billion, while inflation remained low. Chemical companies, having recently learned to convert petroleum into plastic grew two and a half times as fast the economy as a whole. Because the economy grew strongly in the fifteen years after the war, the debt as a percentage of GNP declined precipitously. It had been nearly 130 percent of GNP in 1946. By 1960 it was a mere 57.75 percent. Although national debt rose by a third in the decade of the 1960s, the first time the debt had risen significantly during a time of peace and prosperity the debt to GNP ratio continued to decline, dropping to below 40 percent by 1969 (Gordon 04: 381) (Wells 03: 53).
The Radio Corporation of America (RCA) had been working on television technology since the 1920s but was forced to curtail commercial production in the 1930s for the war effort. In 1948 the United States produced 1 million television sets, and two years later 7.5 million. By 1950 the US had 150 television stations and by 1960 580 stations were broadcasting. In 1954 RCA came out with the color television (Wells 03: 31). The radio and especially the television, allow the mass of the public to hear, see and judge for themselves (Schlesinger 99: 269). On the other hand, television has dismally reduced both the intellectual content of campaigns and the attention span of political audiences. In the nineteenth century political speeches generally lasted for two or three hours and dealt with issues in systematic and exhaustive fashion. Voters drove wagons for miles to hear Daniel Webster and Henry Clay, William Jennings Bryan and Fighting Bob La Follette and felt cheated if the famous orator did not give them their money’s worth. Then radio came along and cut the length of political speeches first to an hour, soon to thirty minutes. In recent years the fifteen minute talk has given way to the commercial spot. Advertising agencies sell candidates in sixty seconds with all the cynical skill and contrivance they previously devoted to selling mouthwash and detergents. Television moreover is the major cause of the appallingly high costs of modern political campaigns (Schlesinger 99: 270).
Between 1945 and 2000 employment increased two and half times, and output quintupled. Established industries such as steel and textiles gradually decayed as new one such as computers blossomed. Capitalism predominated. That is to say, private, profit seeking enterprises provided most goods and services, employed most workers, and commercialized most innovations. This was true even in sectors that were regulated by the government or that supplied it (Wells 03: 53). Liberals attributed the country’s economic success chiefly to the social context; diligent workers, wise laws, rich markets, good infrastructure, and plentiful natural resources. Conservative credited prosperity first and foremost to entrepreneurs, who devised new products or better ways to make and market established ones. International policy rested on the assumption that the country’s economic and political well-being demanded prosperity abroad. Weakness in the larger world economy would damage American industry, and economic hardship could breed political instability. Most U.S. government officials believed that general prosperity required a relatively open international economic system, with few barriers to trade or investment and the free exchange of currencies. Ultimately a country’s wealth depends not on what it has but on what it is. Natural resources play out, factories depreciate, and technology becomes obsolete. To prosper over generations, a country must continually reorganize its economy, devising new products and new ways of making and marketing existing ones. This is often disconcerting and painful, but it represents the only alternative to economic stagnation. Dynamic societies need innovations, the vast majority of which originate with entrepreneurs in the private sector. But entrepreneurs are products of their environment, statute and resources (markets, labor and capital) and tolerate the dislocations that their efforts sometimes bring. During the second half of the twentieth century, the United States did all of this as well as any nation on earth (Wells 03: 195).
Paul Samuelson, the country’s leading Keynesian and the first American recipient of the Nobel Prize in Economics, wrote, “With proper fiscal and monetary policies, our economy can have full employment and whatever rate of growth it wants”. In 1957and 1958, however, inflation accelerated and the economy sank into a recession. To explain this phenomenon Keynesian economists devised the Phillips Curve. The economist A.W. Phillips, an Australian working in Britain, had observed that, historically, inflation and unemployment had an inverse relationship. If one was low, the other tended to be high. This relationship led Keynesians to postulate a trade-off between unemployment and inflation; improvement in one inevitably led to deterioration in the other. They attributed this phenomenon to economic “friction” the power of big business and large union to push prices and wages up in advance of demand and to keep them stable as sales and employment fell. Keynesians calculated that, as matters stood in the United States, 4 percent unemployment would entail 3 percent inflation, while inflation under 2 percent required unemployment of 5 to 6 percent (Wells 03: 55).
President Kennedy, relatively conservative, moved to stimulate the economy by means of tax cuts rather than increased spending, especially in the highest brackets, cutting them from 91 percent to 70 percent. When enacted shortly after his death, they worked as intended. Between 1963 and 1966 the economy grew between 5 and 6 percent a year, while unemployment dropped below 4 percent from 5.7 percent (Gordon 04: 381). In early 1963 President Kennedy proposed a bold initiative , he suggested a tax cut even though the economy was prosperous. Kennedy argued that the economy could grow faster still, pointing to an unemployment rate that stubbornly failed to decline below 5 percent. He also claimed that more rapid economic expansion would pay for at least part of the tax reduction. His proposal would reduce the basic tax on income from 20 to 24 percent and the top rate from 90 to 70 percent, with other rates down proportionally. Corporate levies would decline too. The tax cut became law in 1964, after Kennedy’s death. The New Economics yielded favorable results through 1965. Over five years, inflation registered less than 2 percent a year, a level so low that many economists considered it synonymous with price stability. Production expanded by 27 percent over these years, and joblessness fell from 6.7 to 4.5 percent. The federal government did run a modest deficit each year, but rapid economic growth meant that total federal debt as a percentage of GDP fell from 55 percent to 44 percent. Meanwhile the current account showed a surplus of more than $6 billion in 1964 and $5 billion in 1965, the highest levels since the immediate postwar era (Wells 03: 59-60).

Kennedy’s
successor, Lyndon Johnson, declared a “War on Poverty” in 1964. According to the president, “It demands an
end to poverty and racial injustice, to which we are totally committed in our
time, but that is just the beginning.
The Great Society is a place where every child can find knowledge to
enrich his mind and enlarge his talents.
It is a place where leisure is a welcome chance to build and
reflect. It is a place where the city of
man serves not only the needs of the body and the demands of commerce, but the
desire for beauty and the hunger for community.
It is a place where man can renew contact with nature.” Federal spending on domestic programs
increased from 7.1 percent of GDP in 1960 to 9.4 percent of GDP in 1968 an
increase of about one-third. The Great
Society had perhaps its greatest economic impact through the reform of health
care. In 1965 Congress created Medicare
(health insurance for the elderly) and Medicaid (health insurance for the
poor). In 1968, 5 percent of federal
spending went to health care programs, by 1980 the figure was 9.4 percent and
by 2000 Medicare and Medicaid absorbed almost 20 percent of Washington’s
outlays (Wells 03: 60-61) (Gordon 04: 381).
The Great Society’s
proliferation of new federal grant in aid programs had created a maze that
state and local officials found difficult to navigate. The number of grants in aid exploded from 160
programs in 1962 to more than 600 in 1981.
From 1970 to 1980, their cost increased from $24 billion to $82.9 billion
(Katz 01: 81).
The Department of Health, Education and Welfare established in 1953 to consolidate the scattered welfare programs, began with a budget of $2 billion, less than 5 percent of expenditures on national defense. Twenty-five years later, in 1978, its budget was $10 billion, one and a half times as much as total spending on the army, navy and air force. It had the third largest budget in the world, exceeded only by the entire budget of the U.S. government of the Society Union. The department supervised a huge empire, penetrating every corner of the nation. More than one out of every 100 persons employed worked in the HEW empire, either directly for the department or in programs for which HEW had responsibility but which were administered by state or local government units. In late 1979, HEW was subdivided by the creation of a separate Department of Education (Friedman 80: 96).
Fig. 10.3 Health Expenditure as a % of the U.S. GDP
1965-2005

Source: Center For Disease Control. Gross Domestic Product and National Health Expenditure
Medicine is the latest welfare
field in which the role of government has been exploding. State and local governments, and to a lesser
extent the federal government, have long had a role in public health
(sanitation, contagious diseases, etc. ) As late as 1960 government
expenditures for civilian health purposes, omitting the military and veterans,
were less than $5 billion or a little over 1 percent of the national
income. After the introduction of
Medicare and Medicaid in 1965, government spending on health mounted rapidly,
reaching $68 billion by 1977, or about 4.5 percent of national income. The government share of total expenditures on
medical care has almost doubled from 25 percent in 1960 to 42 percent in
1977. President Carter came out in favor
of national health insurance, through in a limited form because of financial
constraints. Senator Edward M. Kennedy
has not such inhibitions, he favors the immediate enactment of complete
government responsibility for the health care of the nation’s citizens
(Friedman 80: 112). Extra government
spending has been paralleled by a rapid growth in private health
insurance. Total spending on medical
care doubled from 1965 to 1977 as a fraction of national income. Medical facilities have expanded, too, but
not as rapidly as expenditures. The
inevitable result has been sharp increases in the price of medical care and in
the incomes of physicians and others engaged in rendering medical services
(Friedman 80: 113). The voluntary system of financing and delivery of medical
care which had been developed in Britain over the preceding 200 years was almost
entirely eliminated by the creation of their National Health Service. The national system however doesn’t always
produce results. In the eight-year
period between 1965 and 1973, hospital staffs in total increased in number by
28 percent, administrative and clerical help by 51 percent. but output, as measured by the average number
of hospital beds occupied daily, actually went down by 11 percent. At all times there was a waiting list for
hospital beds of around 600,000 people (Friedman 80: 114).
The American economy began to deteriorate sharply in the
1970s. Unemployment, which had been at
only 3.5 percent in 1968, rose to 4.9 percent in 1970 and to 5.9 percent in
1971. According to Keynesian theory,
increasing inflation and increasing unemployment could not happen at the same
time, and a new word was coined in 1970 to denote the unprecedented situation,
stagflation (Gordon 04: 383). The stock
market, which had been rising steadily since the early 1950s but in the early
seventies sank back to the worst bear market since the early 1930s (Gordon 04:
383). Between 1954 and 1977 Detroit lost about half of its manufacturing jobs;
between 1947 and 1982 the number of manufacturing jobs in Chicago plummeted
from 668,000 to 277,000. This
deindustrialization reflected the spectacular foreign growth of industries such
as electronics and automobiles, as well as corporate America’s search for lower
wage and production costs in the suburbs.
In New York housing development pushed 100 large manufacturing firms and
330 firms of all sizes from the city between 1946 and 1954. At the same time, governments also created
massive numbers of city jobs. Between
1929 and 1974, government employment grew more than any other category in the
national economy. These jobs were
concentrated in central cities as state and local governments. “To compete in a global economy,” argues the
Department of Housing and Urban Development 1998 report State of the Cities,
“cities and their suburbs must cooperate more than they compete” (Katz 01:
34). The best description of the social
impact of “stagflation” is that the arbitrary gauge of the annual increase in
productivity of the worker declined from over 3 percent to less than 1 percent. Americans ceased to hold their workers in
very high regard, although productivity growth gradually increased in the 80s
and 90s, it was not until the turn of the century that workers productivity
growth again reached the 3 percent mark.
In the 1970s a group of scholars centered at the University of
Chicago suggested a new approach to anti-trust that became known as “law and
economics”. They argued that consumer
welfare was the proper object of the anti-trust laws and that courts should
employ economic analysis to decide cases (Wells 03: 130). The
major legislation shaping the framework for private pensions is the 1974
Employment Retirement Income Security Act (ERISA) which superseded state law,
set the standards to which private pensions plans must adhere in order to
retain their favored tax status, and created a new government agency to insure
benefits in case employers went out of business. ERISA also added pension incentives for
individuals through individual retirement accounts and pensions for the self-employed
(called Keoghs) and legalized employee stock-ownership plans. Four years later influential new legislation
established deferred compensation plans called 401(k)s that excluded from
taxation a portion of pay that individuals chose to put aside for a later date,
usually retirement. In 1996 pension
contribution deductions cost the government $69.6 billion in forgone revenues,
an amount much larger than the income lost through the deductibility of home
mortgage interest (Katz 01: 179). On the
downside Nixon created the Drug Enforcement Agency (DEA) in 1973 which
monopolized the mind altering toxins used to drive people crazy while publicly
enforcing the prohibition of recreational drugs people use to keep sane. The nation has not subsequently recovered
from this bioterrorist injustice, that parallels the role of J. Edgars Hoover’s
FBI in the Prohibition of alcohol and subversion of the Hoover Administration
that triggered the Great Depression, but the illicit drug consuming population
is smaller and health care costs have gradually risen to tyrannize the
population more than in any other country and income inequality has greatly
increased nationally and around the world.
The reaction to the DEA was instant anger at being falsely arrested
under Schedule I, on the part of the hashish smoking OPEC countries.
By the 1970s America had become
dependent upon the Organization of Oil Exporting Countries (OPEC) for their
oil. As a result of the 1973 Yom Kippur
War between Israel and its Arab neighbors, many oil-exporting countries refused
to export to the United States. Long
lines formed at gas stations and prices for oil products rose steeply. With gas prices on the rise, more gas
efficient European cars saw a sharp rise in demand. By the mid-1970s more than two-thirds of jobs
in the American economy were in service.
The official poverty rate, which had fallen from 22 percent in 1959 to
11 percent in 1973, rose to 15 percent by 1983.
The amount of steel produced in the country remained constant at about
100 million tons a year but the number of steel worker declined from 2.4
million in 1974 to less than a million in 1998 (Gordon 04: 388). Gas shortages reemerged in the late 1970s
while inflation only increased. Stock
price, which had recovered from their disastrous 1974 low, began to decline
again. By 1977 almost everyone who had
seriously studied the matter agreed that controls on domestic oil did more harm
than good. The Carter administration
developed a program that combined gradual deregulation with subsidies to
encourage both conservation and the development of alternative sources of
energy. The Iranian revolution of
1978-79 temporarily halted oil production in that nation. Buyers panicked and began purchasing all the
gasoline and oil they could find, thereby creating the shortage they
feared. OPEC took advantage of the
situation, doubling its posted price for oil, and by 1980 a barrel of crude
cost close to $40. Ironically oil
production outpaced consumption at this time.
Consumer prices rose more than 10 percent in 1979 and almost 14 percent
in 1980. The dollar began to fall
against other currencies of industrial democracies in 1977, reflecting a large
U.S. deficit on the current account, over $10 billion, as well as the
perception that inflation was increasing in the United States (Wells 03: 107).
In 1973 the long postwar boom ended. A generation of prosperity gave way to a decade of stagnation characterized by sluggish growth and steadily rising prices. Between 1973 and 1975 the United States lurched from one disaster to another. The period started with another devaluation of the dollar. The large U.S. payments deficit in 1972 had damaged confidence in the greenback, and in January 1973 currency traders sold hundreds of millions of dollars. The industrial democracies quickly agreed to devaluate the dollar by 10 percent against the currencies of Western Europe and Japan, this failed to halt the crisis. The dollar stabilized about 10 percent below its 1972 peg. The cheaper dollar encouraged a boom in exports that left the United States with a solid current account surplus for 1973. Prices surged in 1973 strong demand pushed wholesale prices up at a 20 percent annual rate while consumer prices increased at more than an 8 percent rate. Although in January Nixon scrapped wage and price controls, in the spring Nixon capped the prices of meat and domestically produced oil. In June he introduced a 60 day freeze on all prices. In the fall of 1973 the Arab oil embargo added a new dimension to the country’s economic woes. In October, during Yom Kippur, Israel and its Arab neighbors went to war for the fourth time in twenty-five years. Unlike the previous three conflicts, in which Israel triumphed easily, the Arabs won some important victories at the outset of the 1973 war. The Israelis desperately requested military aid from the United States, which Washington granted, and with this help repulsed their opponents. But U.S. intervention infuriated the Arab world, which included several leading oil exporters, Saudi Arabia, Iraq, Kuwait, and Libya. These countries terminated all oil shipments to the United States and cut their total output by 5 percent a month. Before the embargo the world’s oil fields were already operating at capacity to supply consumers, so these cutbacks created a severe, across the board shortage. In 1974 the Organization of Petroleum Exporting Countries (OPEC) set the official price of oil at $11.65 a barrel, up from $1.80 in 1970 (Wells 03: 87-79).
During the fall of 1974, after Nixon resigned to avoid impeachment for the Watergate scandal, as financial problems and declining investment made it clear that the economy was in severe recession, the Federal Reserve cut interest rates sharply. By the spring of 1975 the prime rate was down to 7 percent. Despite talk of a second Great Depression, the economy recovered over the summer of 1975. The Federal Reserve made sure that troubled but basically sound companies had access to credit, and once companies had sold off the stocks of raw materials and inventories accumulated in 1973 and 74 as a hedge against inflation, resumed buying. Lower interest rates encouraged a resurgence of investment, which increased by 20 percent in 1976. The federal government assisted recovery by cutting taxes $20 billion, most of which went to individuals in the form of tax rebates. Overall Washington ran a deficit of $53 billion fiscal 1975 and $73 billion 76, a total of 3.3 and 4.1 percent of GDP, respectively, the highest since World War II. All of this combined to drive a healthy if unspectacular recovery that by the end of 1975 had reduced unemployment to 7.5 percent. Yet inflation remained high. Consumer prices rose 9 percent in 1975 despite the downturn (Wells 03: 92-93). The trade balance which had been strongly in favor of the United States in the early years after the Second World War, had inevitably shrunk as foreign economies recovered. In 1959 it had shown a small deficit. But it began to deteriorate rapidly in the late 1960s and in the 1971 it fell into deficit once more and continued to deteriorate. As American inflation increased gold began to flow abroad. On August 15, 1971, President Nixon acted decisively, he renounced the Bretton Woods Agreement and severed the link between the dollar and gold. The dollar would float in value, and the gold standard, after 150 years, was dead. Second, he froze all wages, rents, and prices for a period of ninety days, to be followed by strict wage and price controls, that failed to work and were abandoned (Gordon 04: 384).

Source:
James Goulding. Historical Data.
During the inflation in the
United States from 1969 to 1979, the quantity of money rose at the average rate
of 9 percent per year and prices at the average rate of 7 percent per
year. The difference of two percentage
points reflects the 2.8 percent average rate of growth of output over the same
decade (Friedman 80: 254). In the early
1970s Japan and the United Kingdom experienced inflation at the rate of 30
percent or more a year, when inflation in the United States was around 10
percent and in Germany under 5 percent (Friedman 80: 263). In the five years after the 1973 oil shock
inflation in both Germany and Japan declined, in Germany from about 7 percent a
year to less than 5 percent, in Japan from over 30 percent to less than 5
percent. In the United States inflation
peaked a year after the oil shock at about 12 percent, declined to 5 percent in
1976, and then rose to over 13 percent in 1979.
Hyperinflation in Russia and Germany after World War I, when prices sometimes
doubled and more than doubled form one day to the next, prepared the ground for
communism in the one country and Nazism in the other. The hyperinflation in China after WWII eased
Chairman Mao’s defeat of Chiang Kai-sheck.
Inflation in Brazil, where it reached about 100 percent a year in 1954,
brought military government. A far more
extreme inflation contributed to the overthrow of Allende din Chile in 1973 and
of Isabel Peron in Argentina in 1976, followed in both countries by the
assumption of power by a military junta (Friedman 80: 253). During the German hyperinflation after WWI,
hand-to-hand money grew at the average rate of more than 300 percent a month
for more than a year, and so did prices.
During the Hungarian hyperinflation after WWII, hand-to-hand money rose
at the average rate of more than 12,000 percent per month for a year, and
prices at the even higher rate of nearly 20,000 percent a month (Friedman 80:
263).
The cure for inflation is simple
to state but hard to implement. Just as
an excessive increase in the quantity of money is the one and only important
cause of inflation, so a reduction in the rate of monetary growth is the one
and only cure for inflation. Government
must increase the quantity of money less rapidly (Friedman 80: 270). There are side effects to this cure – slow
growth and high unemployment (Friedman 80: 273). The most important device for mitigating the
side effects is to slow inflation gradually but steadily by a policy announced
in advance and adhered to so it becomes credible, and minimizing damage to long
term contracts (Friedman 80: 277). The
Founding Fathers had perceived the executive as the major threat to financial
prudence, not Congress. After all, Parliament had come into existence in the
Middle Ages precisely to check royal extravagance and to limit the taxing power
of the king. The founding Fathers
expected Congress, to fulfill the same function. The phrase pork barrel entered the American
political lexicon as early as 1904. With
the coming of the New Deal and safety net programs such as Social Security
there also developed a pressure to vote for popular new benefits. While presidents can veto money bills just as
they can any other bill, the veto is a very blunt instrument at best, as the
entire bill must be accepted or rejected, not just the objectionable
spending. Often the only means that the
president has to limit spending is impoundment, first used by Thomas Jefferson
and then by every president since. With
impoundment, the president simply refuses to spend the appropriated money.
As inflation began to heat up in
the later Johnson years, Johnson attempted to control spending by impounding
more and more money. In 1966 he
impounded no less than $5.3 billion out of a total budget of $134 billion,
including $1.86 billion in such popular programs as highways and education
(Gordon 04: 389). When Nixon vetoed the
Federal Water Pollution Act in 1972 because it was in his opinion too
expensive, Congress overrode the veto, when Nixon impounded the $6 billion
Congress saw this as a dire threat to its power of the purse. In retaliation Congress passed the Budget
Control Act of 1974 that removed the president’s power of impoundment and
created the Congressional Budget Office.
The deficit in 1974 was $53 billion, the largest deficit in dollar terms
since the middle of the Second World War.
It increased the national debt by nearly 10 percent in a single
year. By the end of the decade, the
national debt was two and a half times as large as it had been in 1970,
although thanks to the accelerating inflation, it continued to fall as a
percentage of GNP. The Democratic party,
which had dominated the country’s politics since 1932, had become increasingly
out of touch with the electorate and failed to heed the increasingly clear
signals of popular discontent as the American economy floundered in the
1970s. In 1978 the people of California
began a “tax revolt” by sharply limiting by referendum how much local property
taxes could be raised. This sparked tax
revolts elsewhere and calls for reform in the increasingly complex and
arbitrary federal tax code (Gordon 04: 390).
Government expenditures on both older and newer agencies
skyrocketed from less than $1 billion in 1970 to roughly $5 billion estimated
for 1979. Prices in general roughly
doubled, but these expenditures more than quintupled. The number of government bureaucrats employed
in regulatory activities tripled, going from 28,000 in 1970 to 81,000 in 1979,
the number of pages in the Federal Register from 17,660 in 1970 to 36,487 in
1978, taking 127 inches of shelf space.
During the same decade, economic growth in the United States slowed
drastically. From 1949 to 1969, output
per man-hour of all persons employed in private business, rose more than 3
percent a year, in the next decade, less than half as fast, and by the end of
the decade productivity was actually declining (Friedman 80: 191). The secrecy system protects the
executive branch from accountability for its incompetence and its venality, its
errors and on occasion its crimes. The
number of classified documents rose 60 percent from 1973 to 1984 when there
were 19.6 classification decisions and the number of security clearances increased
to 4.2 million. John Taylor of Caroline,
a Jeffersonian philosopher, wrote in 1814, “Executive secrecy is one of the
monarchical customs, plausibly defended and certainly fatal to republican
government” (Schlesinger 99: 300).
Jimmy Carter,
preached loudly in behalf of global human rights, but when the Soviet Union
invaded Afghanistan in late 1979, toward the end of his presidency, he put on a
global sheriff badge saying to a joint session of Congress in his fourth and
final State of the Union Address, “Any attempt by an outside force to gain
control of the Persian Gulf region will be regards as an assault on the vital
interests of the United States of America, and such an assault will be repelled by any means necessary, including
military force” (Starobin 2009). In mid 1979, President Carter
proposed a massive government program stretching over a decade and costing $88
billion to produce synthetic fuel, but this would have raised the price of fuel
from $20 a barrel to $40 a barrel (Friedman 80: 221). The American military was starved for funds
by the now adamantly anti-war Democrats.
The Soviet Union, whose ambitions to world domination had been contained
for three decades by American economic and military power was flexing its muscles
as it had never done before. In late
1979 it invaded Afghanistan to secure a shaky puppet regime. After the Customs Court Act of 1980
established the Court of International Trade of the United States (COITUS), the
United States looked powerless, to avoid using any sexist obscenities. As a result, for the first time since Herbert
Hoover, an elected incumbent president was turned out of office in a
landslide. The American people voted
decisively for change and got Ronald Reagan.
President Reagan is often given the credit for deregulation and lower
taxes, but they were, in fact, already under way when he took office. By the time Reagan took over, inflation was
finally being brought under control, thanks to the Federal Reserve and its new
chairman, Paul Volcker, who was appointed by Jimmy Carter in 1979. Interest rates soared to their highest point
in US history, even the federal government, by definition the best credit risk
in the country, had to pay 15.8 percent to sell twenty-year bonds (Gordon 04: 396).

Source: BEA
Policy shifted dramatically in 1979 when President Carter installed Paul Volcker as chairman of the Federal Reserve. Volcker was committed to breaking inflation. He limited the supply of money and let interest rates go up. Throughout 1980 the prime rate averaged 15 percent. Throughout most of the postwar era, output per worker had increased at about 3 percent a year, starting in 1973, however, annual increase slowed to less than 1 percent (Wells 03: 105). In late 1980 recession made individuals and business far less eager to take out loans. The extraordinary cost of money pushed the economy back into recession. In 1982 housing starts fell to fewer than 1.1 million, the lowest level of the postwar era, and total investment fell by 14 percent. By the end of the year unemployment had surged to 11 percent, the worst since the depression. Between the end of 1979 and the end of 1982 the American economy did not grow at all. In the summer of 1982 the central bank relaxed its hold on credit, and money found its way to those who wanted it. The prime rate finally declined below 10 percent in 1983. Investment increased by 9 percent in 1983 and 30 percent in 1984 fueling a strong expansion (Wells 03: 117). The inevitable result of Volcker’s policy, which was endorsed by the new Reagan administration, was a deep recession, the worst since the 1930s. For the first time since the Great Depression, the unemployment rate rose above 10 percent while the stock market fell below 800 on the Dow. Inflation had raged at 13.5 percent in 1980, the next year it was at 10 percent, in 1982 it was 6.2 percent, the lowest since the early 1970s. In 1983 it was 4.1 percent. It averaged less than that for the rest of the decade. With inflation under control, interest rates began to decline. With lowering interest rates, borrowing and investment picked up, and the recession came to an end.
By the 1980s three quarters of the American economy consisted of services, and overall growth reflected steady expansion in that sector. The percentage of young people who finished college, 31 percent in 1970, climbed to more than 40 percent by the end of the century (Wells 03: 128). In aggregate terms the American economy performed well between 1983 and 1989. GDP grew, on average, almost 4 percent a year and consumer prices advanced at about 3.5 percent annually . Unemployment fell from 11 percent at the start of 1983 to less than 5.5 percent in 1989, even thought the labor force grew by 12 percent over the same period. Productivity improved only slightly and wages could therefore not increase. The gap between rich and poor widened. In 1977 the poorest 20 percent of American families received 4.4 percent of national income; by 1993 their share had dropped to 3.6 percent. Meanwhile the wealthiest 20 percent of families increased their share of total income from 43.6 to 48.9 percent. In the 1970s and 80s single parent households became more common and this lowered household income while at the other end of the spectrum wealthy women were increasingly working. As late as 1970 organized labor represented a third of the nonagricultural workforce. By 1990 the number was down to 16 percent. Increasingly organized labor concentrated on those working in government, who did not have to worry about competition. By the 1990s fewer than 10 percent of workers in the private sector belonged to unions, roughly the same portion as in 1930 (Wells 03: 122, 123, 134).
“Government is not the solution to our problem”, Ronald Reagan said in his first inaugural address. “Government is the problem” (Schlesinger 99: 220). The Reagan administration had its greatest impact on the tax code. In 1981 it secured legislation reducing income tax rates 25 percent over three years and immediately cutting the top rate from 70 to 50 percent. By the mid 1980s income taxes were once again claiming 7.5 to 8 percent of the GDP, the same level as during the 60s, down from 9.2 percent in the late 1970s. A second wave of tax reform came during 1986. Washington outlawed a host of tax shelters that had allowed the wealthy to avoid levies, increased the basic deduction to remove the poor from tax rolls, and cut the number of income tax brackets to three. During his administration Reagan cut the top tax rate on individuals from 70 to 29 percent, with other rates down substantially as well. In 1986 income tax receipts totaled 7.9 percent of GDP, in 1989 under the new code, the total was 8.2 percent. It seems under the right conditions reduction in the tax rates could generate more revenue (Wells 03: 116). The radical right supply-side follies of the Reagan era reversed the U.S. pattern 1914 to 1985 of being a creditor nation (Samuelson 08). Because of the restructuring of the American economy in the 1980s the dollar strengthened markedly against other currencies. Foreign investment in the United States rose sharply and by the late 1980s foreigners owned about $400 billion more in assets in the United States than American citizens owned abroad, reversing the situation that had been the case since the First World War (Gordon 04: 401).
|
|
1980 |
1981 |
1982 |
1983 |
1984 |
1985 |
|
GDP |
5,839 |
5,987 |
5,871 |
6,136 |
6,577 |
6,849 |
|
Growth |
-0.3% |
2.5% |
-1.9% |
4.5% |
7.2% |
4.1% |
|
Int. Trade Balance |
8.5 |
3.4 |
-3.3 |
-35.1 |
-90.1 |
-114.3 |
|
% GDP |
0.2% |
0.06% |
-0.06% |
-0.6% |
-1.4% |
-1.7% |
|
Budget Deficit |
-59.0 |
-57.9 |
-110.7 |
-195.4 |
-178.2 |
-203.2 |
|
% GDP |
-1.0% |
-0.9 |
-1.9% |
-3.2% |
-2.7% |
-2.9% |
|
|
1986 |
1987 |
1988 |
1989 |
1990 |
1991 |
|
GDP |
7,087 |
7,313 |
7,614 |
7,886 |
8,034 |
8,015 |
|
Growth |
3.5% |
3.2% |
4.1% |
3.6% |
1.9% |
-0.2% |
|
Int. Trade Balance |
-142.7 |
-154.1 |
-115.7 |
-92.4 |
-74.9 |
7.9 |
|
% GDP |
-2.0% |
-2.1% |
-1.5% |
-1.2% |
-0.9% |
0.09% |
|
Budget Deficit |
-221.1 |
-148.4 |
-154.3 |
-153.3 |
-220.5 |
-269.5 |
|
% GDP |
-3.1% |
-2.0% |
-2.0% |
-1.9% |
-2.7% |
-3.4% |
Source: Table 1.1.1, 1.1.6, 3.18B, 4.3A, 4.3B BEA NIPA Tables
During the 1980s the budget and trade deficits dominated public discussion of economic policy. Unlike questions of income inequality, union membership, anti-trust law, or depressed industries, they served as a convenient focus for concerns about the future widely shared by Americans. Federal debt grew more rapidly in the 1980s than at any time since World War II. During the 1980-82 recession the deficit expanded sharply as revenue fell and Washington spent freely on unemployment insurance and other relief measures. Deficits became a real problem only after 1982. Economic recovery brought no drop in federal borrowing, which remained in the vicinity of $150 to $200 billion a year, or roughly 3 to 5% of GDP, for the rest of the decade (Wells 03: 135). Between 1980 and 1996 total government debt as a portion of GDP doubled, from one-third of GDP to two-thirds. Over the same period Washington’s annual interest expenses grew from 1.9 percent of GDP to 3.2 percent, or by 68 percent. Democrats blamed President Reagan’s tax cuts and defense buildup, pointing out that between 1980 and 1986, in terms of percent of GDP, income tax revenue fell by almost 20 percent and military outlays grew by 30 percent. Republicans, taking a longer perspective, blamed deficits on growing social outlays. They observed that taxes, as a portion of GDP, were slightly higher in 1985 than in 1965, whereas defense spending was slightly lower. Nevertheless in 1965 the federal deficit was negligible, whereas in 1985 it was huge. Outlays for Social Security, Medicare and Medicaid accounted for almost all the difference. Federal healthcare outlays grew from 0.25% of GDP in 1965 to 2.4 percent two decades later (860 percent) and old age pensions from 2.4 to 4.5 percent of GDP over the same period (84 percent). Notwithstanding, party platforms, at its core the deficit reflected anemic growth in productivity and income after 1973 (Wells 03: 136).
In 1987 the Dow-Jones Industrial Average had reached 2,500, three times higher than where it had been a mere five years earlier. In October of that year the market suffered the worst crash since 1929 and the worst one day decline in percentage terms, 22.8 percent, in history. Many thought this signaled the start of a new Great Depression, but the market recovered the next day and reached a new high within fifteen months. For the first time since Alexander Hamilton had stemmed the panic of 1792 federal monetary authorities had performed as they should in a moment of financial crisis (Gordon 04: 398). Despite the deficits the economy did fairly well. Between 1983 and 1996, the country suffered only one recession, the relatively mild downturn of the 1990-91 recession, and it had to rely on its allies to pay for the 1991 Gulf War (Wells 03: 137). Government deficits kept interest rates much higher than they would have been otherwise. During the 1980s the prime rate never fell below 8 percent, and the rate on the bonds of the most creditworthy companies never declined below 9 percent (Wells 03: 138). During the 1980s the United States ran a huge deficit on its current account. Unlike the federal deficit this gap grew rather than diminished in the 1990s. In 1980 the current account had been in balance, with a surplus on services and investment income compensating for a small trade deficit. Trade was expanding fast, with exports growing from 3.7% of GDP in 1969 to 8.1% in 1980, reflecting strong demand for U.S. farm commodities and large devaluations of the dollar in 1971-73 and 1977-79. The rapid appreciation of the dollar changed things. It priced many American goods out of foreign markets and between 1980 and 1985 exports slipped from 8.1 percent to 5.1 percent of GDP while imports remained stable as a portion of GDPO. By 1986 the overall deficit on the U.S. current account was more than $100 billion. By the end of the decade the United States had, for the first time since World War I, become a net debtor on its international account, owing the rest of the world, in aggregate, more than it was owed. Exports began to recover after 1985 and the dollar fell by more than a third between 1985 and 1988 (Wells 03: 139).
While Congress had been willing to fund Reagan’s military buildup, it had not been willing to enact his cuts in domestic social programs. Between March 1981 and November 1983, state agencies, under federal pressure, carried out over a million disability reviews and concluded that the benefits of 470,000 persons should end. The SSA did not deny a larger share of initial applications or terminate a higher proportion of cases, rather it vastly increased the number of cases it reviewed, from 83,651 in 1978 to 436,498 in 1983. The SSA benefit denials rate rose from 19 percent in 1980 to 60 percent in 1984. With the rate of success in court high, the proportion appealing their cases increased from 70 percent to 90 percent. The Reagan administration had promised to cut 500,000 from the disability rolls. In the end, after appeals, the number was 83,360, a small figure in light of the expense of litigation and the suffering of the disabled who had to fight their way through the courts to win back their benefits. By February 1984, thirty-eight states refused to process disability reviews. SSA finally suspended reviews for eighteen months and in 1984 Congress passed the Disability Reform Act (402 to 0 in the House and 99 to 0 in the Senate (Katz 01: 215). As a result, the annual federal deficit mounted sharply. Just as in the 1970s, it more than tripled in dollar terms, from $909 billion in 1980 to $3.2 trillion in 1990.
But because the rampant inflation of the 1970s had been stopped, the size of the debt relative to GDP, had increased rapidly. Only 34.5 percent of GDP in 1980, by 1990 it was 58.15 percent and climbing rapidly to $4.6 trillion in 1994, 68.9 percent of the GDP. The recession of 1990-91 was the mildest of the twentieth century, and the economy soon began to grow again. About the only perceived weakness in the American economy was the unfavorable trade balance, which deepened relentlessly during this time. In 1990, after torturous negotiations, congress finally enacted a compromise that limited future spending, including Medicare and Medicaid and raised the income tax on earnings over $85,000 from 28 percent to 31 percent. Estimates suggested that the measure would cut federal borrowing by a total of $500 billion over the next five years. One-third of savings would come from higher taxes, the rest from spending reductions. President Bush paid a high political price for this accomplishment. Many conservative Republicans complained that he had betrayed them by accepting tax hikes. Patrick Buchanan later challenged Bush for the 1992 Republican nomination costing Bush credit for reducing the deficit. In the 1992 election, the independent Ross Perot, who based his campaign on deficit reduction, won nearly 20 percent of the vote. Just as every Democratic president in the generation after the Great Depression had his own version of Franklin D. Roosevelt’s New Deal, Truman’s Fair Deal, Kennedy’s New Frontier, Johnson’s Great Society, so too did every ambitious Republican in the generation following Reagan have a program of tax cuts. But tax cuts are not always appropriate. By reducing the highest marginal rate from 70 to 28 percent, the Reagan administration no doubt significantly stimulated enterprise. By 1990, however, the deficit was a far greater problem than a 31 percent income tax rate (Wells 03: 159-161).
Fig. 12.3 Effective
Federal Tax Rates 1979 & 2000
|
Income Group |
Effective Tax Rate (percent) |
Share of Taxes Paid (percent) |
Share of Pretax Income (percent) |
Average After-Tax Income (2000 $) |
||||
|
1979 |
2000 |
1979 |
2000 |
1979 |
2000 |
1979 |
2000 |
|
|
All |
22.2 |
23.1 |
100.0 |
100.0 |
100.0 |
100.0 |
40,700 |
57,000 |
|
Lowest 20% |
8.0 |
6.4 |
2.1 |
1.1 |
5.8 |
4.0 |
12,600 |
13,700 |
|
Second 20% |
14.3 |
13.0 |
7.2 |
4.8 |
11.1 |
8.6 |
25,600 |
29,000 |
|
Middle 20% |
18.6 |
16.7 |
13.2 |
9.8 |
15.8 |
13.5 |
36,400 |
41,900 |
|
Fourth 20% |
21.2 |
20.5 |
21.0 |
17.4 |
22.0 |
19.6 |
47,700 |
59,200 |
|
Top 20% |
27.5 |
28.0 |
56.4 |
66.7 |
45.5 |
54.8 |
84,000 |
141,400 |
|
Top 10% |
29.6 |
29.7 |
40.7 |
52.2 |
30.5 |
40.6 |
106,300 |
201,400 |
|
Top 5% |
31.8 |
31.1 |
29.6 |
41.4 |
20.7 |
30.7 |
140,100 |
299,400 |
|
Top 1% |
37.0 |
33.2 |
15.4 |
25.6 |
9.3 |
17.8 |
286,300 |
862,700 |
|
Source: Congressional Budget Office. 2003. Effective Federal
Tax Rates, 1997-2000. August |
||||||||
Between 1992 and 2000 the United States enjoyed extraordinary
prosperity, on par with that of the 1960s.
Even worker productivity began to increase. In the first half of the 1990s public
investment dominated economic debate (Wells 03: 165). In Fed chairman Alan Greenspan’s first year
in office the president steered through Congress a deficit-reduction package to
cut federal borrowing by $500 billion over the next five years. Although the measure did limit spending,
higher taxes provided two-thirds of deficit reduction. The package raised levies on gasoline and
increased the tax on incomes above $180,000 from 31 to 36 percent and on
incomes above $250,000 from 31 to almost 40 percent. The administration considered its program a
great success. The deficit fell
steadily, and in fiscal 1999 the federal government ran a surplus for the first
time since 1969. This reflected both
higher taxes and lower spending. In 2000
federal taxes took more than 20 percent of GDP, the highest level ever, while
Washington’s outlays fell to 18.1 percent of GDP for the first time since the
mid-1960s (Wells 03: 166). The primary
problem was that federal health-care outlays increased from 2.7 percent of GDP
in 199- to 3.8 percent in 1998 or 40 percent although 15 percent of the American
population lacked health insurance (Wells 03: 167). At its peak in the
late 1960s, Pentagon defense spending accounted for nearly 14 percent of the
California economy. Even as late as
1990, California’s economy depended more on the defense sector than did New
York’s on Wall Street. From 1989 to 1994
California suffered the closure of twenty-one military bases, including the
Presidio, containing eighty-two thousand military and civilian personnel. By comparison, the rest of the nation lost
bases accounting for a total of thirty-seven thousand personnel. From 1990 to 1994, California lost 146,000
jobs in the defense aerospace sector, a decline of 45 percent. After the Second World War the Pentagon
supplied a crucial stimulus of the region’s development – Defense Department
purchases accounted for some 40 percent of Silicon Valley’s output of
semiconductors, its signature product.
But by the 1980s the Pentagon’s share was down to only 8 percent.
Wall Street boomed.
The late 1990s in the United States were the greatest period of wealth creation
in the history of the world. The numbers
are almost beyond imagination. In 2000
the minimum wealth required to make the Forbes list was $725 million and the
average worth was $3 billion. The
richest of all was Bill Gates worth $63 billion, almost ten times the wealth of
the richest American twelve years before.
263 of the 400 richest Americans in 2000 were self-made, only 19 percent
had inherited enough money to qualify (Gordon 04: 418). Despite Clinton’s increased
effort in labor relations union membership as a percentage of the workforce
continued to decline, falling from 16 percent in 1990 to 14 percent by 2000
despite prosperity and declining unemployment after 1992. Growth in the United States between 1992 and
2000 averaged more than 4 percent a year while unemployment gradually declined
to 4 percent, the lowest level since the late 1960s. Productivity began to grow expanding at a 2.6
percent annual rate between 1995 and 2000, allowing a substantial expansion of
real, inflation adjusted income. Between
1992 and 2000 total revenue in information technology, including broadcasting
and telephones, grew from $371 billion to $815 billion. In 1997 American factories shipped $78.5
billion in semiconductors and $66 billion in computers, up 144 and 66 percent,
respectively, from 1992. Much of this growth reflected the development of new
industries such as satellite television, cellular telephones whose number grew
from 5.2 million in 1990 to 109.5 million in 2000 (Wells 03: 174).
The American century came to a screeching halt on the morning of September 11, 2001 when a hijacked airliner slammed into the north tower of the World Trade Center in New York. A few minutes later a second hit the south tower. In less than two hours both building collapsed, killing thousands of innocent people. A third plane struck the Pentagon, the symbol of American military might and a fourth crashed in a Pennsylvania field. For the first time since Pearl Harbor, the United States had been attacked on American soil. It was the first time since British troops landed in Louisiana in December 1814 that the mainland itself had been under attack. For the fourth time in less than a century, the United States was at war (Gordon 04: 419). While it will probably never be known if the suicide attacks were in fact permitted by the DEA in a failed attempt to destroy COITUS, the wars in Afghanistan and Iraq have impressed upon the American and European public that their governments are corrupt. The 9-11 suicide attacks galvanized the international community under the UN Millennium Development Goals for 2015, serving to enforce a post-American century, Afghan Millennium, where the poorest people are paid, because the focus international economic cooperation is truly equal rights. We hope that global equality of income will not take longer than the 21st century, but the principle of paying the poor holds true, and the truth of the matter is that if the rich continue to make war on the poor, we may all be sentenced to a millennium of struggle, to achieve our dream of a peaceful and prosperous world for all, this century. The United States, self-styled tyrannical substance abusing pervert, and Europe, under the iron fist of the infringement of the International Criminal Court (ICC) on the International Chamber of Commerce (ICC) need to make both peace and freedom. In any case the budget surpluses and economic prosperity of President Clinton’s second term immediately ceased when Bush took office, while the international trade deficit skyrocketed and budget deficit.
Fig. 13.1
GDP Change from Previous Period, Annual and Quarterly 2000-2009

Source: BEA Percent Change from Preceding Period in Gross
Domestic Product
The economy has been troubled when
a lame duck leaves office since 1980 when the corruption of the DEA was set in
the stone of the COITUS and we entered the current age of inequality. With so much money laundered under executive
secrecy the departure of an Administration is accompanied with large
withdrawals of capital and economic failure as the truth vacates, and the
propaganda becomes useless. At the end
of the Carter administration and beginning of the Reagan administration
inflation and high interest rates drove a recession with high unemployment
during the recession of 1980-1982. The
stock market crashed in October of 1987 shortly before Reagan left office in
1988 although the Federal Reserve responded properly (Gordon 04: 398) the number of bank failures skyrocketed from 217 in 1987
to a high of 531 in 1989 and not normalized to less than 50 until after Clinton
took office in 1993. When Bush first
took office the economy turned negative in first quarter 2001 with the
foundation of the mildly sexist but extremely dangerous font of bioterrorism,
Centers for Medicare, Medicaid and SCHIP (CMS), by the third quarter the
perpetrators of Clinton’s unsettled false arrests and tortures had started a
war to divert attention from the domestic slave trade, and the loss of the
World Trade Center caused another economic downturn. A recession, defined as two quarters of
negative economic growth had been narrowly averted for an economic growth rate
of 1.1% in 2001. Pleading war powers, as
was his intention when taking office, Bush tried to stimulate the economy with
tax cuts and rebates with a lasseiz-faire policy that cut into government
revenues, and to enjoy the freedom to make war, financed his wars privately
through deficit spending, as did his partners in war crime, the European Union.
Fig. 13.2 Federal
Budget and Debt 2000-2010 (in billions of dollars)
|
|
2000 |
2001 |
2002 |
2003 |
2004 |
2005 |
|
GDP |
9,208 |
9,821 |
10,225 |
10,980 |
11,686 |
12,446 |
|
Revenues |
2,025 |
1991 |
1,853 |
1,782 |
1,880 |
2,154 |
|
% GDP |
20.6% |
19.5% |
17.6% |
16.2% |
16.1% |
17.3% |
|
Outlays |
1,789 |
1,863 |
2,011 |
2,160 |
2,293 |
2,472 |
|
% GDP |
18.2% |
18.2% |
19.1% |
19.7% |
19.6% |
19.9% |
|
Balance |
236 |
128 |
-158 |
-378 |
-413 |
-318 |
|
% GDP |
2.4% |
1.3% |
-1.5% |
-3.4% |
-3.5% |
-2.6% |
|
Debt |
5,629 |
5,770 |
6,198 |
6,760 |
7,355 |
7,905 |
|
% GDP |
57.3% |
56.4% |
58.8% |
61.6% |
62.9% |
63.5% |
|
|
2006 |
2007 |
2008 |
2009 |
2010 |
|
|
GDP |
13,225 |
13,896 |
14,439 |
14,237 |
14,624 |
|
|
Revenues |
2,407 |
2,568 |
2,524 |
2,105 |
2,165 |
|
|
% GDP |
18.2% |
18.5% |
17.5% |
14.8% |
14.8% |
|
|
Outlays |
2,655 |
2,729 |
2,983 |
3,518 |
3,721 |
|
|
% GDP |
20.1% |
19.6% |
20.7% |
24.7% |
25.4% |
|
|
Balance |
-248 |
-161 |
-459 |
-1,413 |
-1,556 |
|
|
% GDP |
-1.9% |
-1.2% |
-3.2% |
-9.9% |
-10.6% |
|
|
Debt |
8,451 |
8,951 |
9,986 |
11,876 |
13,787 |
|
|
% GDP |
63.9% |
64.4% |
69.2% |
83.4% |
94.3% |
|
Source: Tables 1.1, 1.2 and 7.1 OMB Historical Tables
By 2003 and 2004 the federal
deficit had become alarming, exceeding the arbitrary limit of 3%. Efforts were made to combat the deficit,
mostly by demanding the return of surplus defense funds, and the deficit was
wrestled under control, to 2.6% in 2005, 1.9% in 2006 and 1.2% in 2007. By 2008 however the lame duck President had
began to engage in deficit spending, including tax rebates, to combat a mostly
imaginary economic crisis mirroring the crisis in Europe where the prosecutor
pillages unchecked by any Constitution, triggered by the bursting of the
housing price bubble, skyrocketing energy prices and motivated by his desire to
steal the defense surplus that had been the focal point of his
administration. The roots of the
financial crisis date back to the beginning of the Bush Administration when
Congress forced banks to issue Adjustable Rate Mortgages to sub-prime borrowers
against their wishes. For a while the
housing market boomed, but when the teaser rate ended, mortgage rates became
more than the low income borrowers could afford, and when RealtyTrac began
their national statistical analysis of foreclosures in 2005 the bottom fell out
of the housing market and the number of foreclosures skyrocketed and continued
unabated. During this time the
international trade deficit soared, reaching record heights. The international community was quite angry
with the United States and to a lesser extent with Europe, for the war in Iraq
that distracted their attention from making world peace in Afghanistan. Inflation in the price of oil by OPEC in
silent retaliation for the ruthless military occupation of one of their
founding members drove energy prices through the roof, and with a conflict of
interest with energy interest profits the Bush Administration was blind to the
pain at the pump and the energy bill that was the driving force behind the
foreclosure crisis, as lower income homeowner could not afford both
skyrocketing mortgage and energy rates.

Inflation was a major problem
between 2007 and 2009. Consumer
prices rose by 4.1 percent for all of 2007, up sharply from a 2.5 percent
increase in 2006. The CPI report showed that the 4.1 percent increase
in overall prices was the biggest since a 6.1 percent jump in prices in
1990. Energy costs rose by 17.4 percent
this past year while food costs rose by 4.9 percent. Both were the biggest
increases since 1990. Gasoline prices were up 29.6 percent, the biggest
increase since they soared by 30.1 percent in 1999. The 2.4 percent rise in prices outside of
food and energy in 2007 was the smallest since a 2.2 percent rise in 2005
(Sanders 08: 23). People were paying $4
dollars for a gallon of gas at the height of the oil price inflation which
reached $143 per barrel of oil in July 2008.
During this time the international trade deficit had reached epic
proportions. Running on a deficit since
the 1970s the international trade balance rose from -$380 billion in 2000 to a
high of -$760 billion in 2006, -5.7% of the GDP. In June 2008, the United States achieved a
dubious milestone. For the first time
ever, foreign ownership of U.S. Treasury securities surpassed domestic
ownership: foreigners held $2.781 trillion of total Treasury liabilities of
$5.27 trillion, 52.7 percent, according to U.S. Federal Reserve statistics. Back in the 1970s, the foreign share of
Treasury debt was below 27 percent. Much
of the debt is held by the central banks of rising powers like China, and it is
likely that the foreign share will continue to increase in the years ahead
(Starobin 2009). With Bush’s oil and energy
interests dominating the political scene the inflation went unchecked.
Fig. 13.4 International
Trade in Goods and Services 2000-2009 (in billions of dollars)
|
|
2000 |
2001 |
2002 |
2003 |
2004 |
|
GDP |
9,208 |
9,821 |
10,225 |
10,980 |
11,686 |
|
Total Volume |
2,521 |
2,375 |
2,377 |
2,535 |
2,928 |
|
% GDP |
27.4% |
24.2% |
23.2% |
23.1% |
25.0% |
|
Exports |
1,071 |
1,005 |
978 |
1,020 |
1,159 |
|
% GDP |
11.6% |
10.2% |
9.6% |
9.3% |
9.9% |
|
Imports |
1,450 |
1,370 |
1,399 |
1,515 |
1,769 |
|
% GDP |
15.7% |
13.8% |
13.7% |
13.8% |
15.1% |
|
Balance |
-380 |
-366 |
-422 |
-495 |
-610 |
|
% GDP |
-4.1% |
-3.7% |
-4.1% |
-4.5% |
-5.2% |
|
|
2006 |
2006 |
2007 |
2008 |
2009 |
|
GDP |
12,446 |
13,225 |
13,896 |
14,439 |
14,237 |
|
Total Volume |
3,279 |
3,664 |
3,988 |
4,350 |
3,487 |
|
% GDP |
26.3% |
27.7% |
28.7% |
30.1% |
24.5% |
|
Exports |
1,282 |
1,452 |
1,643 |
1,827 |
1,553 |
|
% GDP |
10.3% |
10.9% |
11.8% |
12.7% |
10.9% |
|
Imports |
1,997 |
2,212 |
2,345 |
2,523 |
1,934 |
|
% GDP |
16.0% |
16.7% |
16.9% |
17.5% |
13.6% |
|
Balance |
-715 |
-760 |
-701 |
-696 |
-381 |
|
% GDP |
-5.7% |
-5.7% |
-5.0% |
-4.8% |
-2.7% |
Source: BEA Trade in Goods and Services 1992-present
When Bush left office he did what his father had done
for his lame duck predecessor, he robbed the bank. In 2008 the number of bank
failures rose from 3 in 2007 to 30 in 2008 and 148 in 2009. Among the bank failures were several large
banks on the Federal Reserve primary dealer list permitted to participate in
open market operations of the Fed, particularly these institutions are the
primary distributors of U.S. government debt, the firms removed from the list
include Lehman Brothers which went bankrupt, Countrywide Securities Corporation
and Merrill Lynch Government Securities Inc. which were purchased by Bank of
America and Bear Sterns & Co. which was purchased by J.P. Morgan
Chase. The causes of insolvency in these
institutions is attributed the securitization of mortgages many of which
foreclosed or were devalued when the housing price bubble burst, but it is more
likely the government is covering up the damage wrought by their excessive
borrowing by blaming the private sector.
The Federal Reserve behaved very strangely in 2008, ceased citing
authors, cut their borrowing in half, an unprecedented and unexplained move,
and in the coup de grace, the Troubled Asset Relief Program, where Congress was
held liable for the suspended Federal Reserve lending at rates far above
market, $700 billion were withdrawn from the stock market and private
investment by the sale of government bonds and recall of laundered government
funds. The market was stretched thin by
the unnecessary stimulus package, and reached breaking point with the
nationalization of the Fannie-Mae and Freddie Mac in July, the $7000 TARP fund
was more than the market could bear. In
the Crash of 2008, 40 percent of stock value has vanished, almost $9
trillion. The
Crash of 2008 is eerily similar to the Crash of 2003 that preceded the Iraq
invasion and can be presumed to the result of the Bush Administration taking
what they can and destroying the rest (Sanders 08: 17).


